Active Directory Diagram

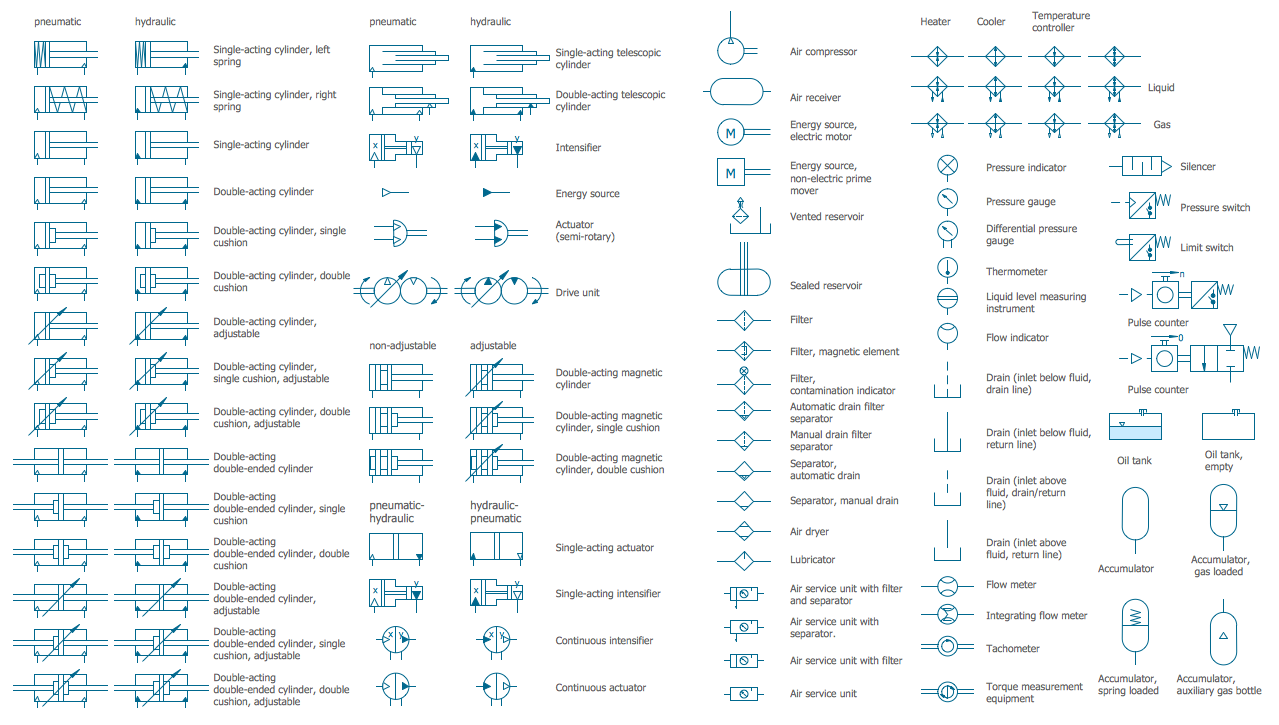
Mechanical Drawing Symbols
 Floor Plans
Construction, repair and remodeling of the home, flat, office, or any other building or premise begins with the development of detailed building plan and floor plans. Correct and quick visualization of the building ideas is important for further construction of any building.
Swim Lane Diagrams

Business Processes

Percentage Pie Chart. Pie Chart Examples

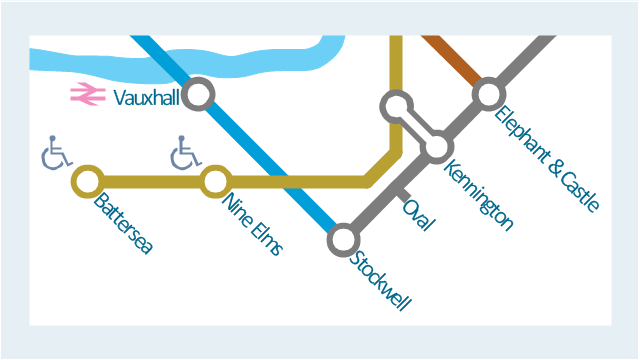
This spatial infographic example was created on the base of the tube map from the Transport for London website.
[tfl.gov.uk/ assets/ images/ general/ 24746-nle-gallery-tube-map.jpg]
"The Tube map is a schematic transit map of the lines and stations of London's public rapid transit railway systems, namely the London Underground (commonly known as the Tube, hence the name), Docklands Light Railway, London Overground and Emirates Air Line, as well as being incorporated into Greater London connections maps.
As a schematic diagram, it shows not necessarily the geographic but rather the relative positions of stations along the lines, stations' connective relations with each other and fare zones. The basic design concepts have been widely adopted for other network maps around the world, especially that of mapping topologically rather than geographically." [Tube map. Wikipedia]
The spatial infographics example "Metro map - Northern line extension to Battersea via Nine Elms" was created using the ConceptDraw PRO diagramming and vector drawing software extended with the Spatial Infographics solution from the area "What is Infographics" of ConceptDraw Solution Park.
Tube map
Pie Chart Examples and Templates

Types of Flowcharts


How to Create a Pie Chart

- Examples Of Air Transport Pictures Easy To Draw
- Air Transport Pictures With Names
- Process Flowchart | Water Vehicles Pictures With Names
- Air Transport Vehicles Pictures
- Aircraft examples | Design elements - Aircraft | Transport - Template ...
- Rail transport - Design elements | Road Transport - Design ...
- Example Of Air Transportation
- Transport Vehicle Chart Name
- Water Tranport Name
- Examples Of Transport On Air