Create Sophisticated Professional Diagrams - Simply

 PM Dashboards
The PM Dashboards solution extends the management boundaries of ConceptDraw DIAGRAM and ConceptDraw PROJECT products with an ability to demonstrate changes to the budget status, to show the project progress toward its objectives, to display clearly the identified key performance indicator (KPI) or the set of key performance indicators for any project. This solution provides you with examples and ability to generate three types of visual dashboards reports based on your project data Project Dashboard, Tactical Dashboard, and Radar Chart. By dynamically charting the project’s key performance indicators that are collected on one ConceptDraw DIAGRAM document page, all project participants, project managers, team members, team leaders, stakeholders, and the entire organizations, for which this solution is intended, have access to the daily status of projects they are involved in.
 PM Easy
PM Easy solution extends the ConceptDraw PROJECT functionality with an ability to support neutral methodology of project management and to quickly start a project by listing the task relationships and dependencies, that makes the iterative planning much easier. The project management tool and available visual tools, such as mind mapping, increase the effectiveness of tracking and analysis your project tasks. PM Easy solution from ConceptDraw Solution Park is mainly targeted at project managers in small or medium-sized companies, allowing them to make the project plan and execute projects using mind mapping technique, to implement planning using mind mapping, and to track tasks using ConceptDraw PROJECT application.
 Visual Reports
The Visual Reports solution extends abilities of ConceptDraw PROJECT by creating the illustrative, informative, colourful and comprehensible reports on a project in a form of visual graphs and diagrams of common types, such as Bar Charts, Pie Charts, Line Charts, Divided Bar Charts, Timelines, Dial Dashboards. This highly effective project management tool helps project managers and other stakeholders to report about the tasks statuses, the project progress and degree of its completion, to evaluate the project status, to depict the project expenses by days and to define the days that go beyond the budget, to compare visually the actual expenses and expected ones at the project planning stage, to generate the Resource chart depicting the utilization of project resources by days, and to show other useful information. The set of tailor-made examples developed for the Visual Reports solution allows designating advantages of each type of report included to this solution for the further use in your management work.
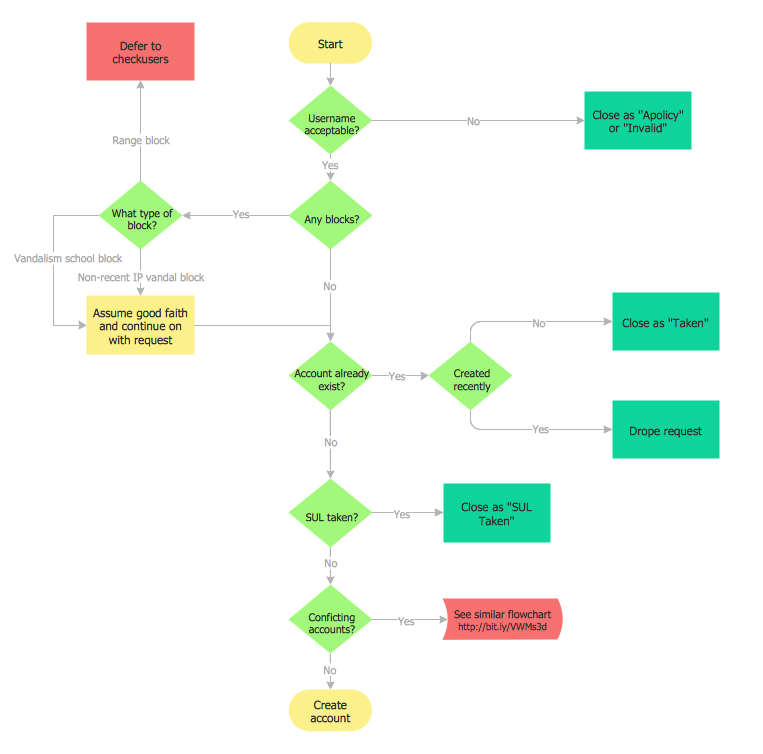
Examples of Flowchart

 Artwork
Artwork solution extends ConceptDraw DIAGRAM software with illustration samples, templates and libraries of vector clipart of architecture, food, music, funny animals, aquatic fauna and transport.
Horizontal Orgchart

Flow Chart Symbols

Sales Process Map

Chart Examples

- Gantt Chart Of Fast Food Restaurant
- Example Of Gantt Related To A Restaurant Business
- Construction A New Restaurant Gantt Chart
- Restaurant Opening Gantt Chart
- Critical Path Method in ConceptDraw PROJECT | Gantt Chart Of A ...
- Gantt Chart Example For Restaurant
- Cafe and Restaurant Floor Plans | Food Court | Layout Of Fast Food ...
- Gantt Chart For Restaurant Management System
- Food Court | How to Design a Fast - Food Restaurant Menu Using ...
- Gantt Chart For Restaurant Business With The Task