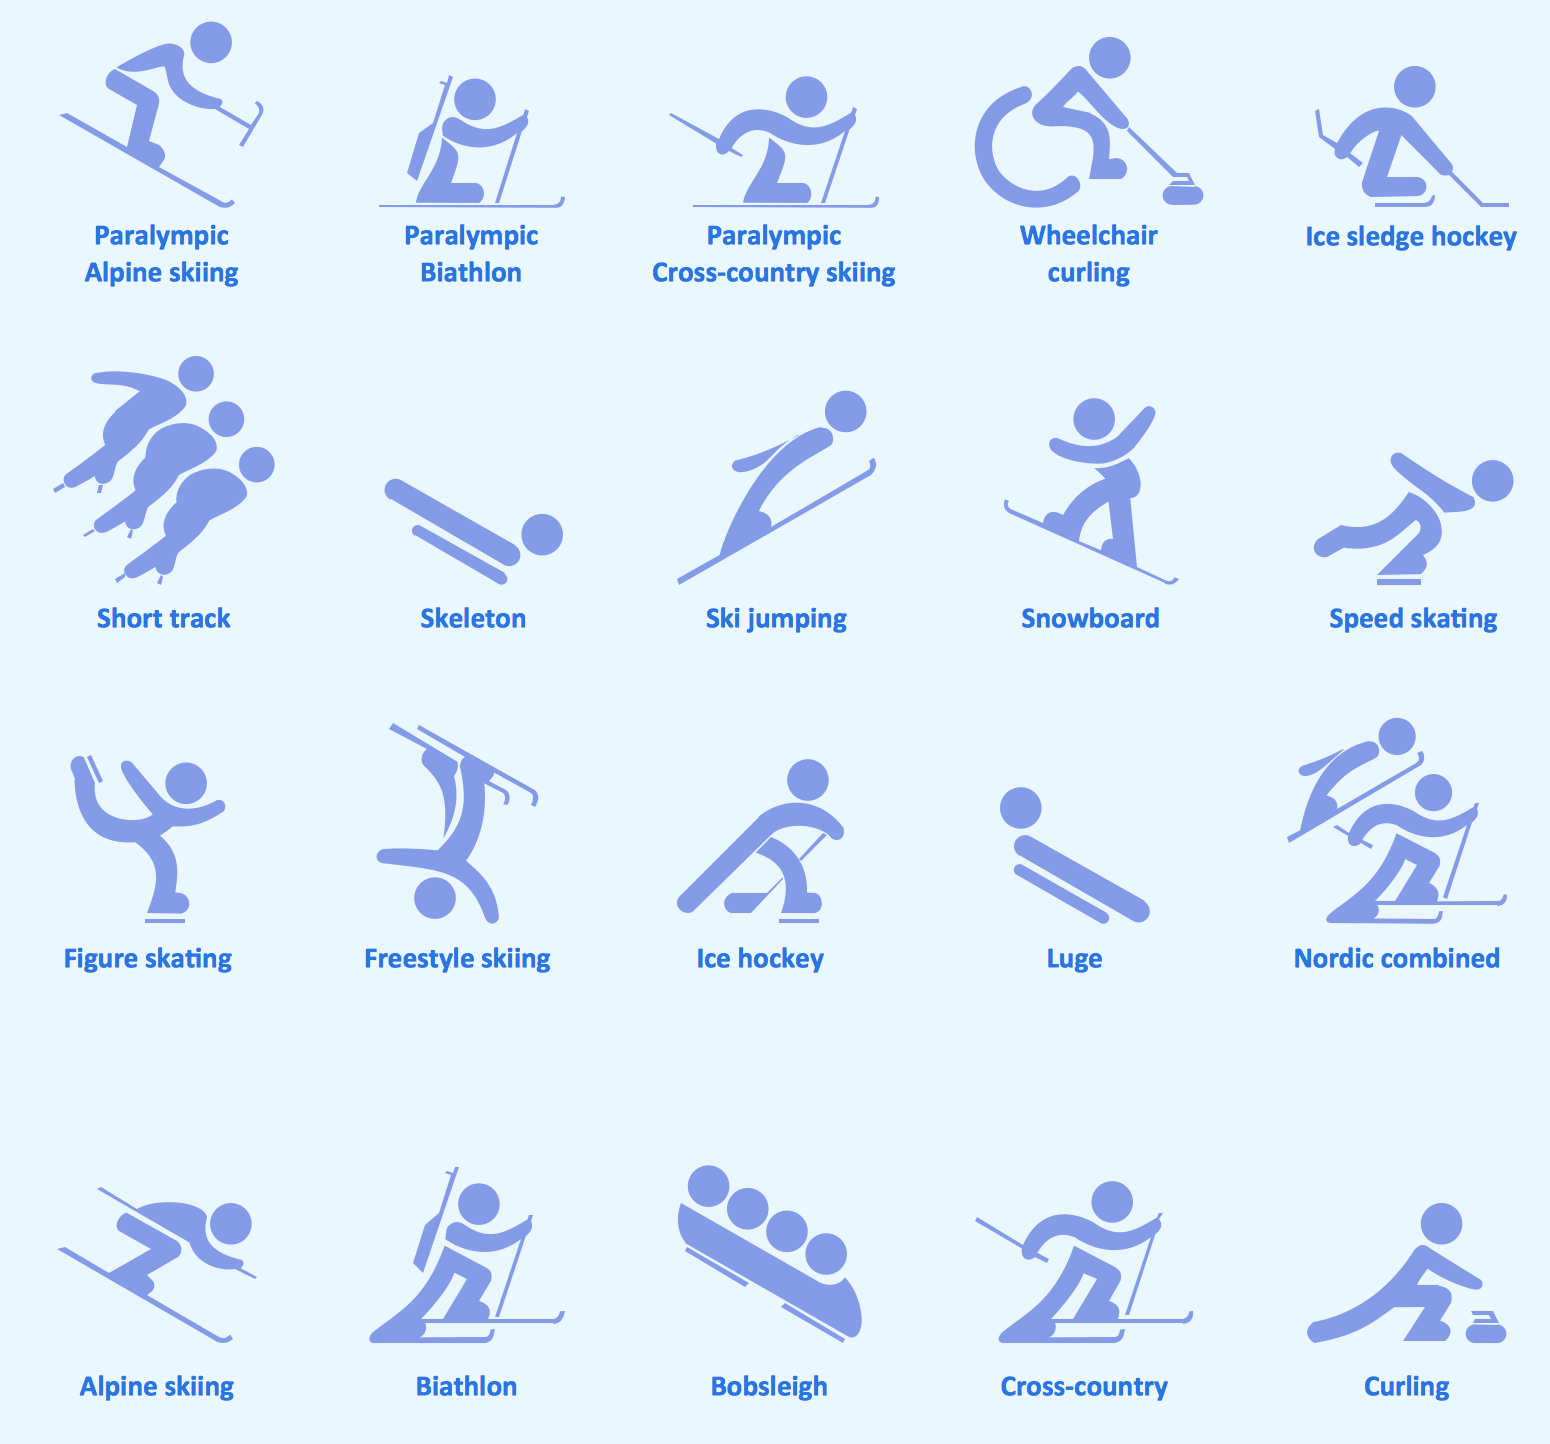
Sport pictograms. Olympic Games
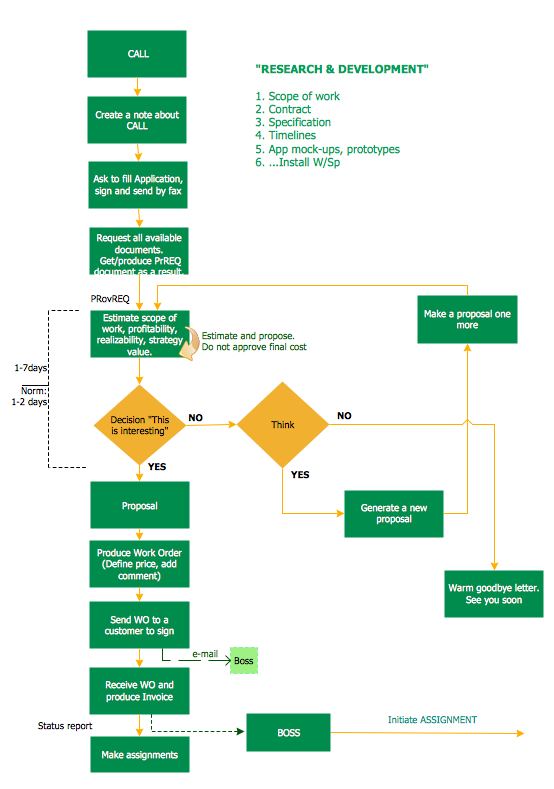
HR Flowchart Symbols

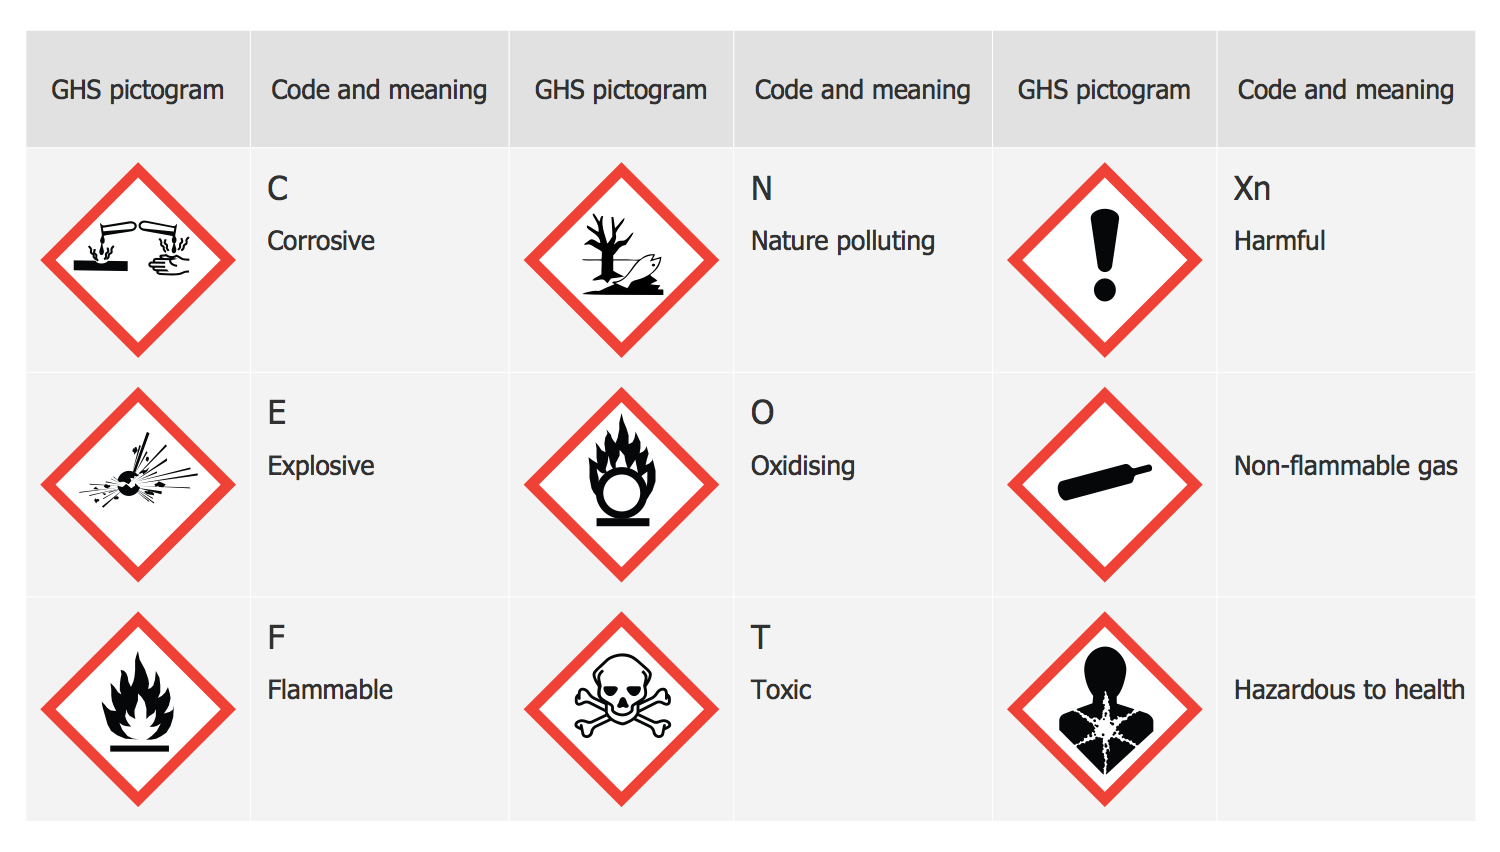
 GHS Hazard Pictograms
GHS Hazard Pictograms solution contains the set of predesigned standard GHS pictograms, Hazardous symbols, and Hazard communication pictograms, approved and agreed by UN in Globally Harmonized System of Classification and Labelling of Chemicals (GHS). They can be used for quick and simple designing accurate and professional-looking infographics, diagrams, warning announcements, signboards, posters, precautionary declarations, regulatory documents, and for representing the main items of OSHA HAZCOM Standard.
How to Draw Pictorial Chart. How to Use Infograms

Design Pictorial Infographics. Design Infographics

Electrical Symbols, Electrical Diagram Symbols

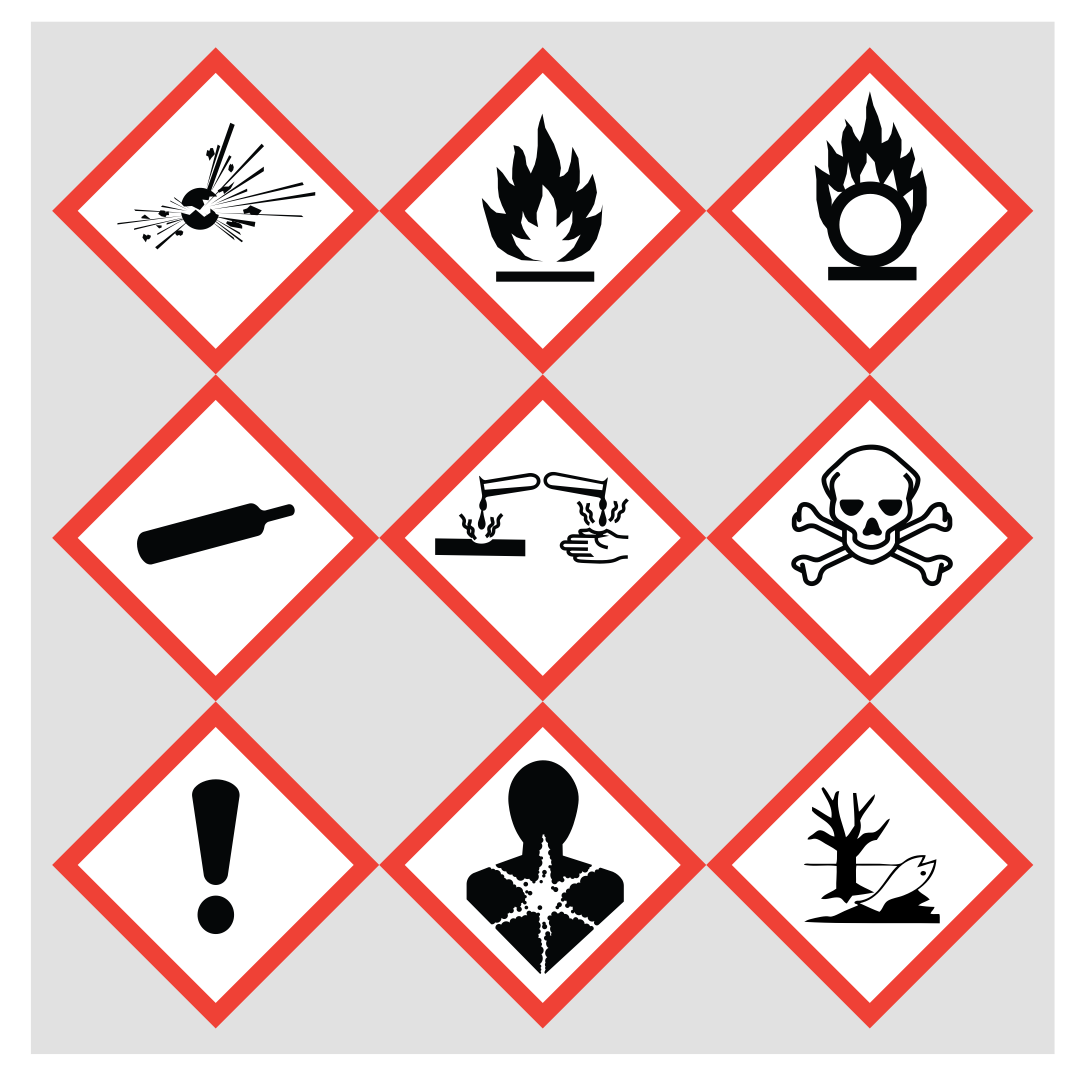
GHS Label Pictograms
Winter Sports. Using Winter Sports Design Elements Producing Infographics

Winter Sports Vector Clipart. Medal Map. Spatial Infographics

Sample Pictorial Chart. Sample Infographics

Best Program to Make Workflow Diagrams
OSHA HAZCOM pictograms
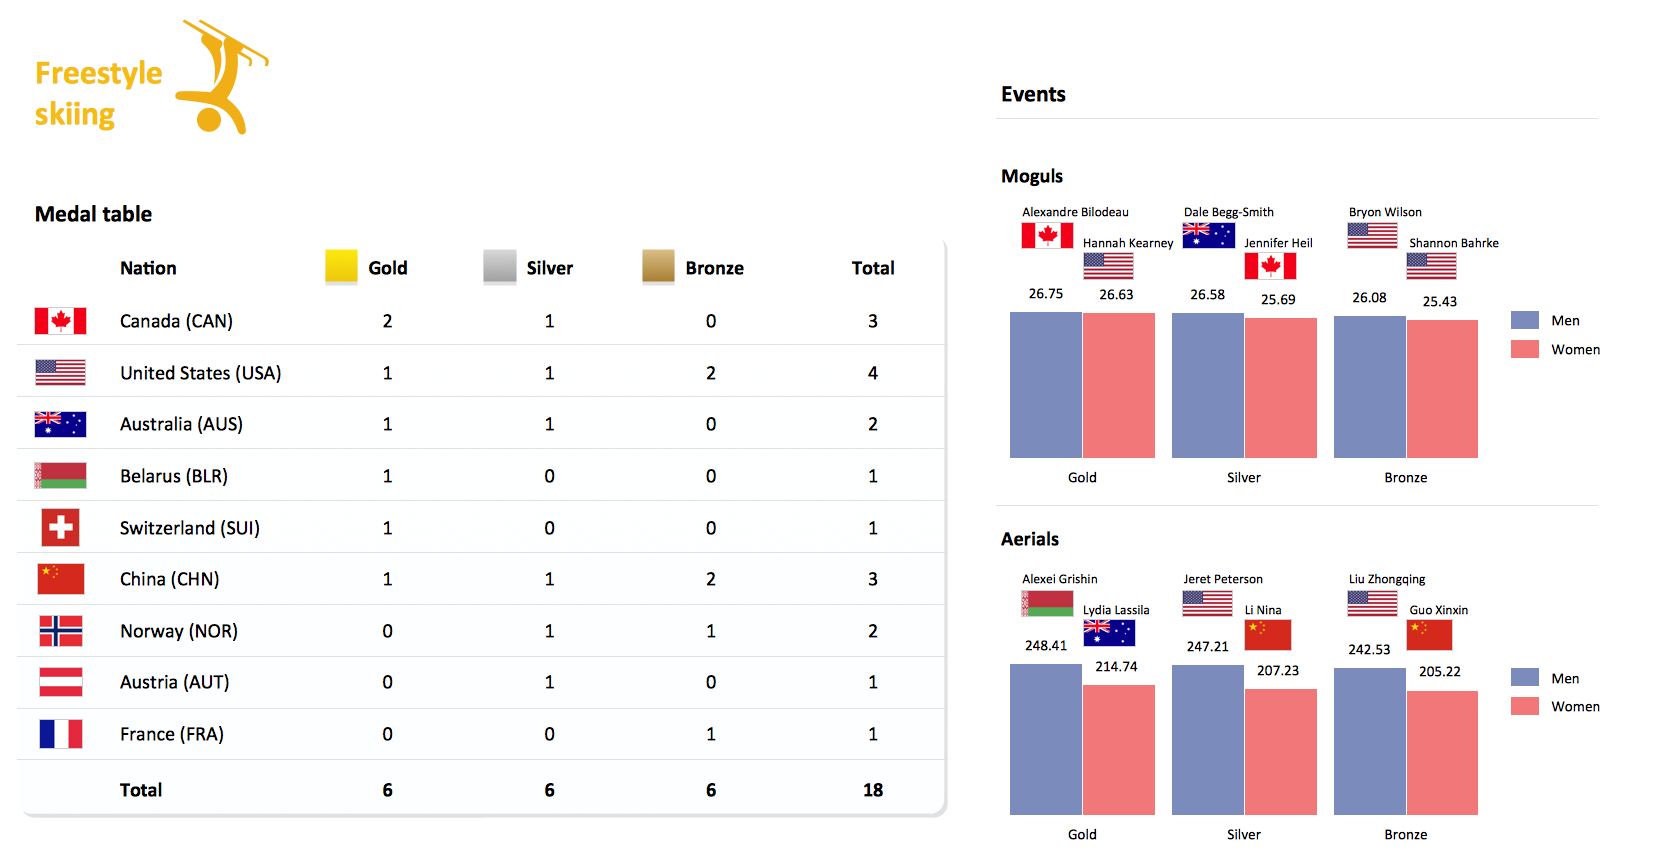
Winter Sports. Olympic Games Illustrations. Medal Summary
- Competitor Analysis | Flowchart Example : Flow Chart of Marketing ...
- Pictograms Examples
- Dna model of seduction - Triangular diagram | Pyramid Chart ...
- Enterprise architecture diagram | Transport pictograms - Vector ...
- Shopping pictograms - Vector stencils library | Electrical Symbols ...
- Example Of Pictogramme
- Office pictograms - Vector stencils library | Entity Relationship ...
- Design elements - UML timing diagrams
- Shopping pictograms - Vector stencils library | Money - Design ...
- Pyramid Diagram | Knowledge hierarchy triangle diagram ...
- Sport pictograms . Olympic Games | Winter Olympics pictograms ...
- Diagram For Alpine Skiing
- Sport pictograms . Olympic Games | GHS Hazard Pictograms ...
- Ecology pictograms - Vector stencils library | Types of Flowcharts ...
- Computer pictograms - Vector stencils library | Design elements ...
- Quality Management System | Flow chart Example . Warehouse ...
- Basketball Court Dimensions | Time and clock pictograms - Vector ...
- Process Flowchart | GHS Label Pictograms | Basketball Court ...
- New GHS Hazard Pictograms Solution for ConceptDraw PRO v11
- Pyramid Diagram | Time - Vector stencils library | Time and clock ...