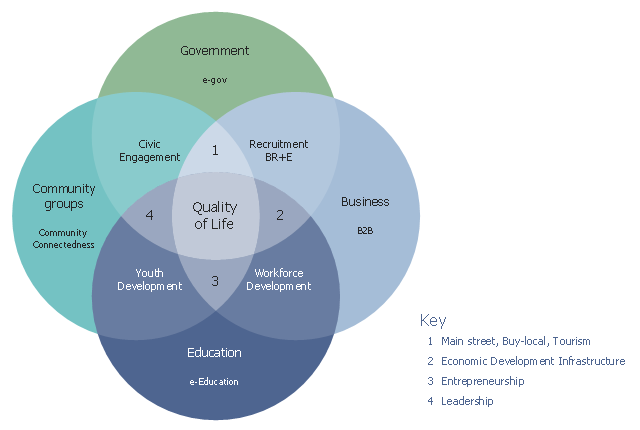
This Venn diagram sample shows how community elements overlap. It was designed on the base of the figure 1 in the course "eStrategies for Local Governments" from the website of the Southern Rural Development Center (SRDC), the Mississippi State University.
"Ultimately, the goal of this curriculum is to position a community for success as they develop web-based strategies for community and economic development. In support of this goal, the authors use a conceptual model that incorporates four fundamental elements (applications) of a community: government, business, education and community groups (Figure 1). Using the Venn diagram, it shows that each of these elements overlap with another, finally culminating in “Quality of Life” where all four overlap." [srdc.msstate.edu/ ecommerce/ curricula/ egovernment/ overview.html]
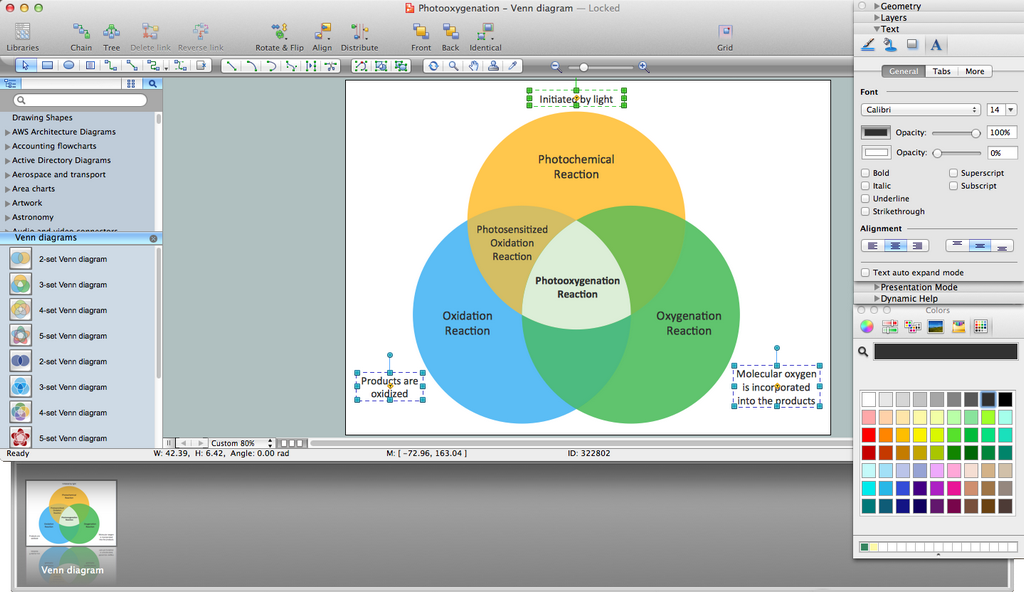
The Venn diagram example "Community elements overlapping" was created using the ConceptDraw PRO diagramming and vector drawing software extended with the Venn Diagrams solution from the area "What is a Diagram" of ConceptDraw Solution Park.
"Ultimately, the goal of this curriculum is to position a community for success as they develop web-based strategies for community and economic development. In support of this goal, the authors use a conceptual model that incorporates four fundamental elements (applications) of a community: government, business, education and community groups (Figure 1). Using the Venn diagram, it shows that each of these elements overlap with another, finally culminating in “Quality of Life” where all four overlap." [srdc.msstate.edu/ ecommerce/ curricula/ egovernment/ overview.html]
The Venn diagram example "Community elements overlapping" was created using the ConceptDraw PRO diagramming and vector drawing software extended with the Venn Diagrams solution from the area "What is a Diagram" of ConceptDraw Solution Park.
Venn diagram
Venn Diagram Examples for Problem Solving. Venn Diagram as a Truth Table

Cylinder Venn Diagram

Venn Diagram

3 Circle Venn. Venn Diagram Example

2 Circle Venn Diagram. Venn Diagram Example

Venn Diagram Template for Word

 Business Diagrams
The Business Diagrams Solution extends ConceptDraw DIAGRAM with an extensive collection of professionally designed illustrative samples and a wide variety of vector stencils libraries, which are the real help for all business-related people, business analysts, business managers, business advisers, marketing experts, PR managers, knowledge workers, scientists, and other stakeholders allowing them to design the bright, neat, expressive and attractive Bubble Diagrams, Circle-Spoke Diagrams, Circular Arrows Diagrams, and Venn Diagrams with different quantity of sets in just minutes; and then successfully use them in documents, reports, statistical summaries, and presentations of any style.
Circles Venn Diagram

Venn Diagram Maker
- Venn Diagrams | Community elements overlapping | Path to ...
- Venn Diagrams | Design elements - Venn diagrams | Community ...
- Community elements overlapping | Germany Map | Venn Diagram ...
- Community elements overlapping | Venn Diagrams | Path to ...
- Stakeholder Onion Diagram Template | Differences And Similarities ...
- Venn Diagram Examples for Problem Solving. Environmental Social ...
- Fundraising pyramid diagram for community based cash donors ...
- Fundraising pyramid diagram for community based cash donors ...
- UML Use Case Diagram Example Social Networking Sites Project ...
- UML Use Case Diagram Example Social Networking Sites Project ...