UML Use Case Diagram Example. Social Networking Sites Project

Fishbone Diagram Problem Solving

TOWS Matrix

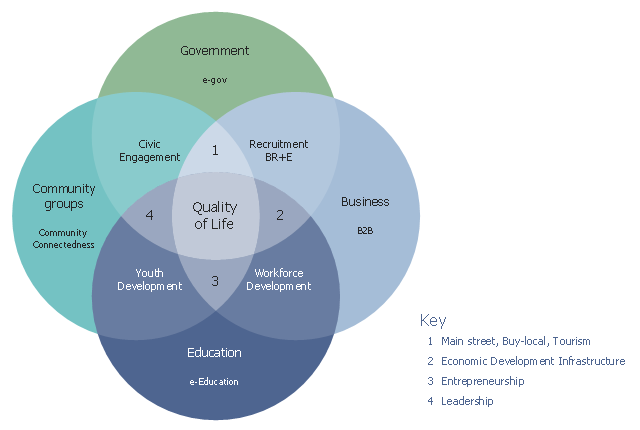
This Venn diagram sample shows how community elements overlap. It was designed on the base of the figure 1 in the course "eStrategies for Local Governments" from the website of the Southern Rural Development Center (SRDC), the Mississippi State University.
"Ultimately, the goal of this curriculum is to position a community for success as they develop web-based strategies for community and economic development. In support of this goal, the authors use a conceptual model that incorporates four fundamental elements (applications) of a community: government, business, education and community groups (Figure 1). Using the Venn diagram, it shows that each of these elements overlap with another, finally culminating in “Quality of Life” where all four overlap." [srdc.msstate.edu/ ecommerce/ curricula/ egovernment/ overview.html]
The Venn diagram example "Community elements overlapping" was created using the ConceptDraw PRO diagramming and vector drawing software extended with the Venn Diagrams solution from the area "What is a Diagram" of ConceptDraw Solution Park.
Venn diagram
Example of DFD for Online Store (Data Flow Diagram)


EPC (Event-driven Process Chain) Flowcharts

Beauty of Event-driven Process Chain (EPC) diagrams

EPC for Configuring an Enterprise Resource Planning

The vector stencils library "Circular diagrams" contains 42 templates of circular diagrams: circular arrow diagram, circular motion diagram, arrow ring chart, doughnut chart (donut chart), circle pie chart, diamond pie chart, circle diagram, pie chart, ring chart, loop diagram, block loop diagram, arrow loop circle, crystal diagram, triangular diagram, diamond diagram, pentagon diagram, hexagon diagram, heptagon diagram, cycle diagram (cycle chart), stacked Venn diagram (onion diagram), arrow circle diagram.
Use these shapes to illustrate your marketing and sales documents, presentations, webpages and infographics in the ConceptDraw PRO diagramming and vector drawing software extended with the Target and Circular Diagrams solution from the Marketing area of ConceptDraw Solution Park.
www.conceptdraw.com/ solution-park/ marketing-target-and-circular-diagrams
Circular arrow diagram 1
Circular arrow diagram 2
Arrow ring chart
Doughnut chart

Diamond pie chart

Pie chart

Circle diagram

Circle pie chart 2

Circle pie chart 1

Ring chart 1 - 3 elements

Ring chart 1 - 4 elements

Ring chart 1 - 5 elements

Ring chart 1 - 6 elements

Ring chart 1 - 7 elements

Ring chart 2 - 3 elements

Ring chart 2 - 4 elements

Ring chart 2 - 5 elements

Ring chart 2 - 6 elements

Ring chart 2 - 7 elements

Crystal diagram - 3 elements

Crystal diagram - 4 elements

Crystal diagram - 5 elements

Crystal diagram - 6 elements

Crystal diagram - 7 elements

Stacked Venn diagram - 4

Stacked Venn diagram - 5

Stacked Venn diagram - 6

Stacked Venn diagram - 7

Basic loop diagram

Block loop diagram

Arrow loop circle
Arrow loop - 3 circles
Arrow loop - 4 circles
Arrow loop - 5 circles
Arrow loop - 6 circles
Arrow loop - 7 circles
Arrow circle diagram - 3
Arrow circle diagram - 4
Stacked Venn diagram - 3

Arrow circle diagram - 5
Arrow circle diagram - 6
Arrow circle diagram - 7
Process Modelling using Event-driven Process chain
- Data Flow Diagram Of E Commerce Website
- Business Process Diagrams | Business Process Workflow Diagrams ...
- Types of Flowcharts | Dfd Diagram For E Commerce Website
- Connecting Social Media To Ecommerce Diagram
- E Commerce Website Data Flow Diagram
- Diagram Of Ecommerce Online Shopping Sites
- Accounting Flowcharts | Business Process Diagrams | Office Layout ...
- Business Process Diagrams | Office Layout Plans | E Commerce ...
- Swim Lane Diagram Ecommerce
- Dfd Diagrams For Ecommerce Website