The vector stencils library "Network layout floorplan" contain 34 symbol icons for drawing computer network floor plans, communication equipment layouts, and structured cabling diagrams.
"Structured cabling is building or campus telecommunications cabling infrastructure that consists of a number of standardized smaller elements (hence structured) called subsystems. ...
Structured cabling design and installation is governed by a set of standards that specify wiring data centers, offices, and apartment buildings for data or voice communications using various kinds of cable, most commonly category 5e (CAT-5e), category 6 (CAT-6), and fibre optic cabling and modular connectors. These standards define how to lay the cabling in various topologies in order to meet the needs of the customer, typically using a central patch panel (which is normally 19 inch rack-mounted), from where each modular connection can be used as needed. Each outlet is then patched into a network switch (normally also rack-mounted) for network use or into an IP or PBX (private branch exchange) telephone system patch panel." [Structured cabling. Wikipedia]
The design elements example "Network layout floorplan - Vector stencils library" was created using the ConceptDraw PRO diagramming and vector drawing software extended with the Network Layout Floor Plans solution from the Computer and Networks area of ConceptDraw Solution Park.
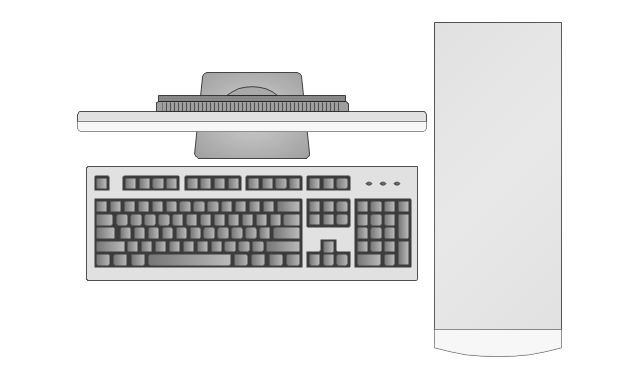
PC
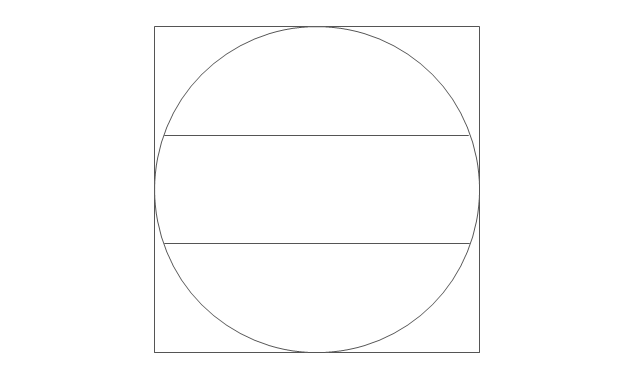
Scanner

Switch

Router

Modem

Hub
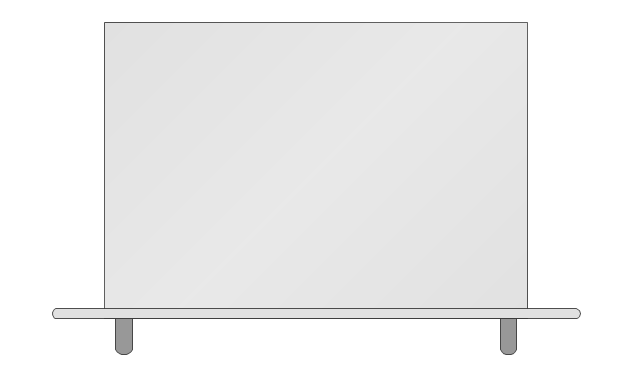
Rack Mount

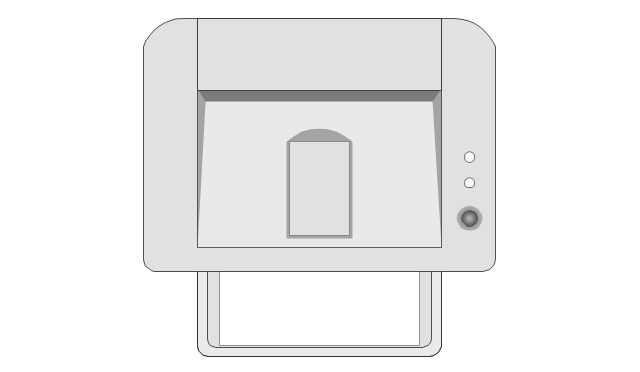
Printer
Floor Mounted Outlet
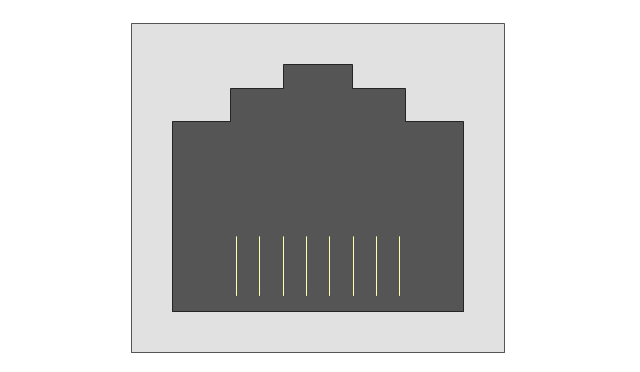
Single Outlet
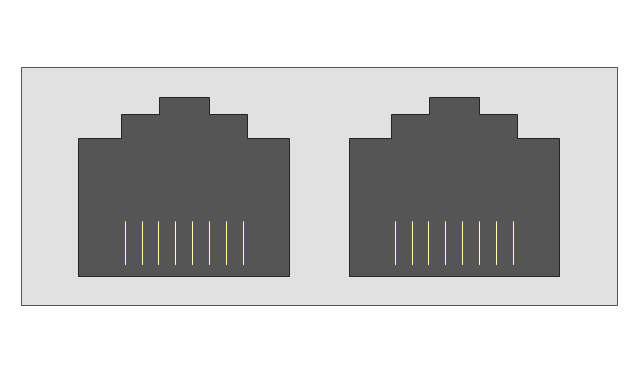
Duplex Outlet
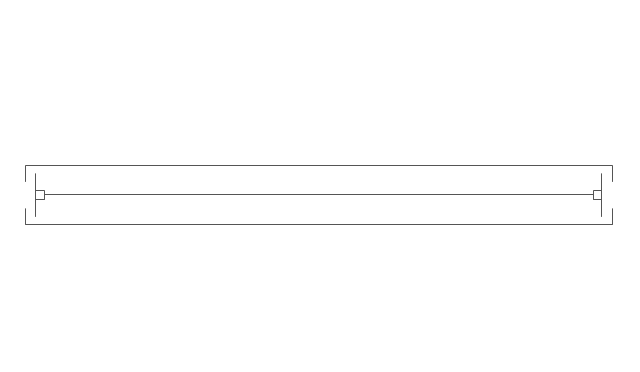
Direct bus cable

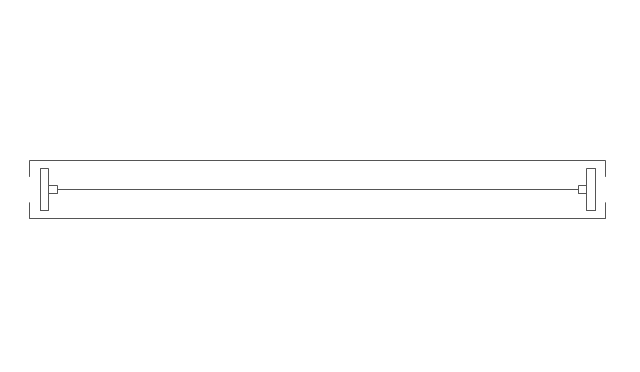
Tops or bottoms bus cable

Side to side bus cable

Multi-tree bus cable

Bottom to side bus cable

Sides bus cable

Door

Door, threshold

Door, stop

Door, stop, threshold

Door, frame

Door, frame, threshold

Door, frame, stop

Door, frame, stop, threshold

Window

Window, sill

Window, sash

Window, sash, sill
Window, frame

Window, frame, sill

Window, frame, sash

Window, frame, sash, sill
HelpDesk
How to Create Organizational Chart Quickly

 Active Directory Diagrams
Active Directory Diagrams solution significantly extends the capabilities of ConceptDraw PRO software with special Active Directory samples, convenient template and libraries of Active Directory vector stencils, common icons of sites and services, icons of LDPA elements, which were developed to help you in planning and modelling network structures and network topologies, in designing excellently looking Active Directory diagrams, Active Directory Structure diagrams, and Active Directory Services diagram, which are perfect way to visualize detailed structures of Microsoft Windows networks, Active Directory Domain topology, Active Directory Site topology, Organizational Units (OU), and Exchange Server organization.
 Computers and Communications
Computers and communications solution extends ConceptDraw PRO software with illustration samples, templates and vector stencils libraries with clip art of computers, control devices, communications, technology, Apple machines.
HelpDesk
How to Create a Fishbone (Ishikawa) Diagram Quickly

HelpDesk
How To Create Risk Diagram (PDPC)
 sample")

HelpDesk
How To Create an Affinity Diagram Using ConceptDraw Office

HelpDesk
How to create an IDEF3 diagram using ConceptDraw PRO

 Bubble Diagrams
Bubble diagrams have enjoyed great success in software engineering, architecture, economics, medicine, landscape design, scientific and educational process, for ideas organization during brainstorming, for making business illustrations, presentations, planning, design, and strategy development. They are popular because of their simplicity and their powerful visual communication attributes.
Process Flowchart


HelpDesk
How to Create an Effective Mind Map Using Topic Types

HelpDesk
How to Insert a Mind Map into Microsoft Word Document

- A Well Structured Floor Plan Of Business Examples
- Process Flowchart | Example Of Well Structured Floor Plan
- Floor Plans | Seating Plans | Fire Exit Plan. Building Plan Examples ...
- Network layout floorplan - Vector stencils library | Single root domain ...
- Design A Well Structured Floor Plan
- Network Layout Floor Plans | Network Layout | Design elements ...
- Well Structured Floor Plan For The Business
- Network Layout Floor Plans | Ethernet local area network layout floor ...
- Well Structured Floor Plan Of A Business
- Design elements - Network layout floorplan | Network layout ...
- A Well Structured Floor Plan Business With Labels For A Security ...
- Network Layout Floor Plans | Network Layout | Design elements ...
- Campus Area Networks (CAN). Computer and Network Examples ...
- A Well Structured Floor Plan Of A Business With All Departments
- Structured Cabling Floor Plan
- Floor Plans | Network layout floorplan - Vector stencils library | Room ...
- UML Class Diagram Example - Apartment Plan | Floor Plans | Flat ...
- Network layout floorplan - Vector stencils library | How to Add a Rack ...
- Network layout floorplan - Vector stencils library | Diagram Of 13 By ...
- How to Create a Floor Plan Using ConceptDraw PRO | Network ...