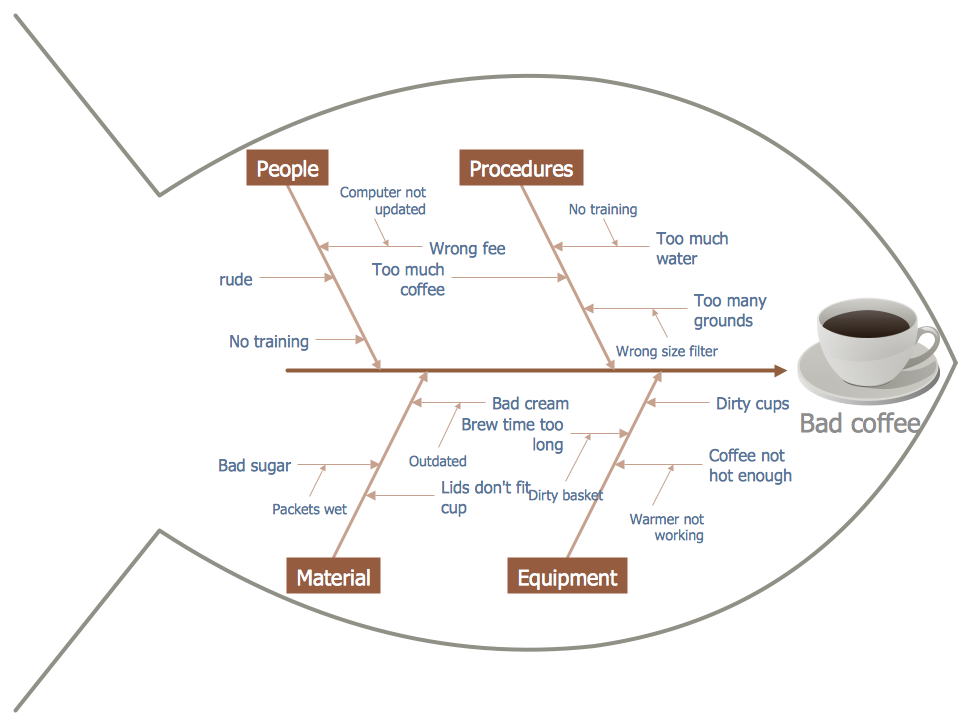
This cause and effect diagram sample was redesigned from the Wikimedia Commons file: Fishbone BadCoffeeExample.jpg. [commons.wikimedia.org/ wiki/ File:Fishbone_ BadCoffeeExample.jpg]
This file is licensed under the Creative Commons Attribution-Share Alike 3.0 Unported license. [creativecommons.org/ licenses/ by-sa/ 3.0/ deed.en]
The fishbone diagram example "Bad coffee" was created using the ConceptDraw PRO diagramming and vector drawing software extended with the Fishbone Diagrams solution from the Management area of ConceptDraw Solution Park.
Fishbone diagram

 Fishbone Diagrams
The Fishbone Diagrams solution extends ConceptDraw DIAGRAM software with the ability to easily draw the Fishbone Diagrams (Ishikawa Diagrams) to clearly see the cause and effect analysis and also problem solving. The vector graphic diagrams produced using this solution can be used in whitepapers, presentations, datasheets, posters, and published technical material.
Café Floor Plan Example

Fishbone Diagram Problem Solving

 Cafe and Restaurant Floor Plans
Restaurants and cafes are popular places for recreation, relaxation, and are the scene for many impressions and memories, so their construction and design requires special attention. Restaurants must to be projected and constructed to be comfortable and e
This SWOT matrix diagram example was created on the base of article "An Easy Way To Jumpstart Your Strategic Plan: SWOT" by Leslie Wolf from the website of the California Digital Library, the University of California. "Strategic planning doesn’t have to be a daunting and lengthy process. The goal is really a simple one: to help you understand your world and build a road map to guide your efforts. ...
This analysis tool can help you focus your attention on the specific success factors that are right for your team.
The tool is called a SWOT analysis. SWOT stands for Strengths and Weaknesses, Opportunities and Threats. Here’s what it means:
(1) Strengths are those positive internal attributes that strengthen your business or team. You can develop plans to capitalize on those strengths.
(2) Weaknesses are those negative internal attributes that are working against your success. You can shore up those weaknesses so they don’t stop your success.
(3) Opportunities are those external conditions that can have a positive effect on your goals. These opportunities can point you in the right direction.
(4) Threats are those external conditions that can have a negative effect on your goals. These threats will affect you less if you can identify and minimize them. ...
We thought it would be helpful to show you a sample SWOT analysis for a business you can easily visualize: a small independent bookstore in a university town. The store owner brought the team together to think about how the bookstore could survive during the continuing financial downturn. After an hour of brainstorming, this is the SWOT analysis they developed." [cdlib.org/ cdlinfo/ 2010/ 09/ 29/ an-easy-way-to-jumpstart-your-strategic-plan-swot/ ]
The matrix diagram example "SWOT analysis for a small independent bookstore" was created using the ConceptDraw PRO diagramming and vector drawing software extended with the SWOT Analysis solution from the Management area of ConceptDraw Solution Park.
SWOT matrix

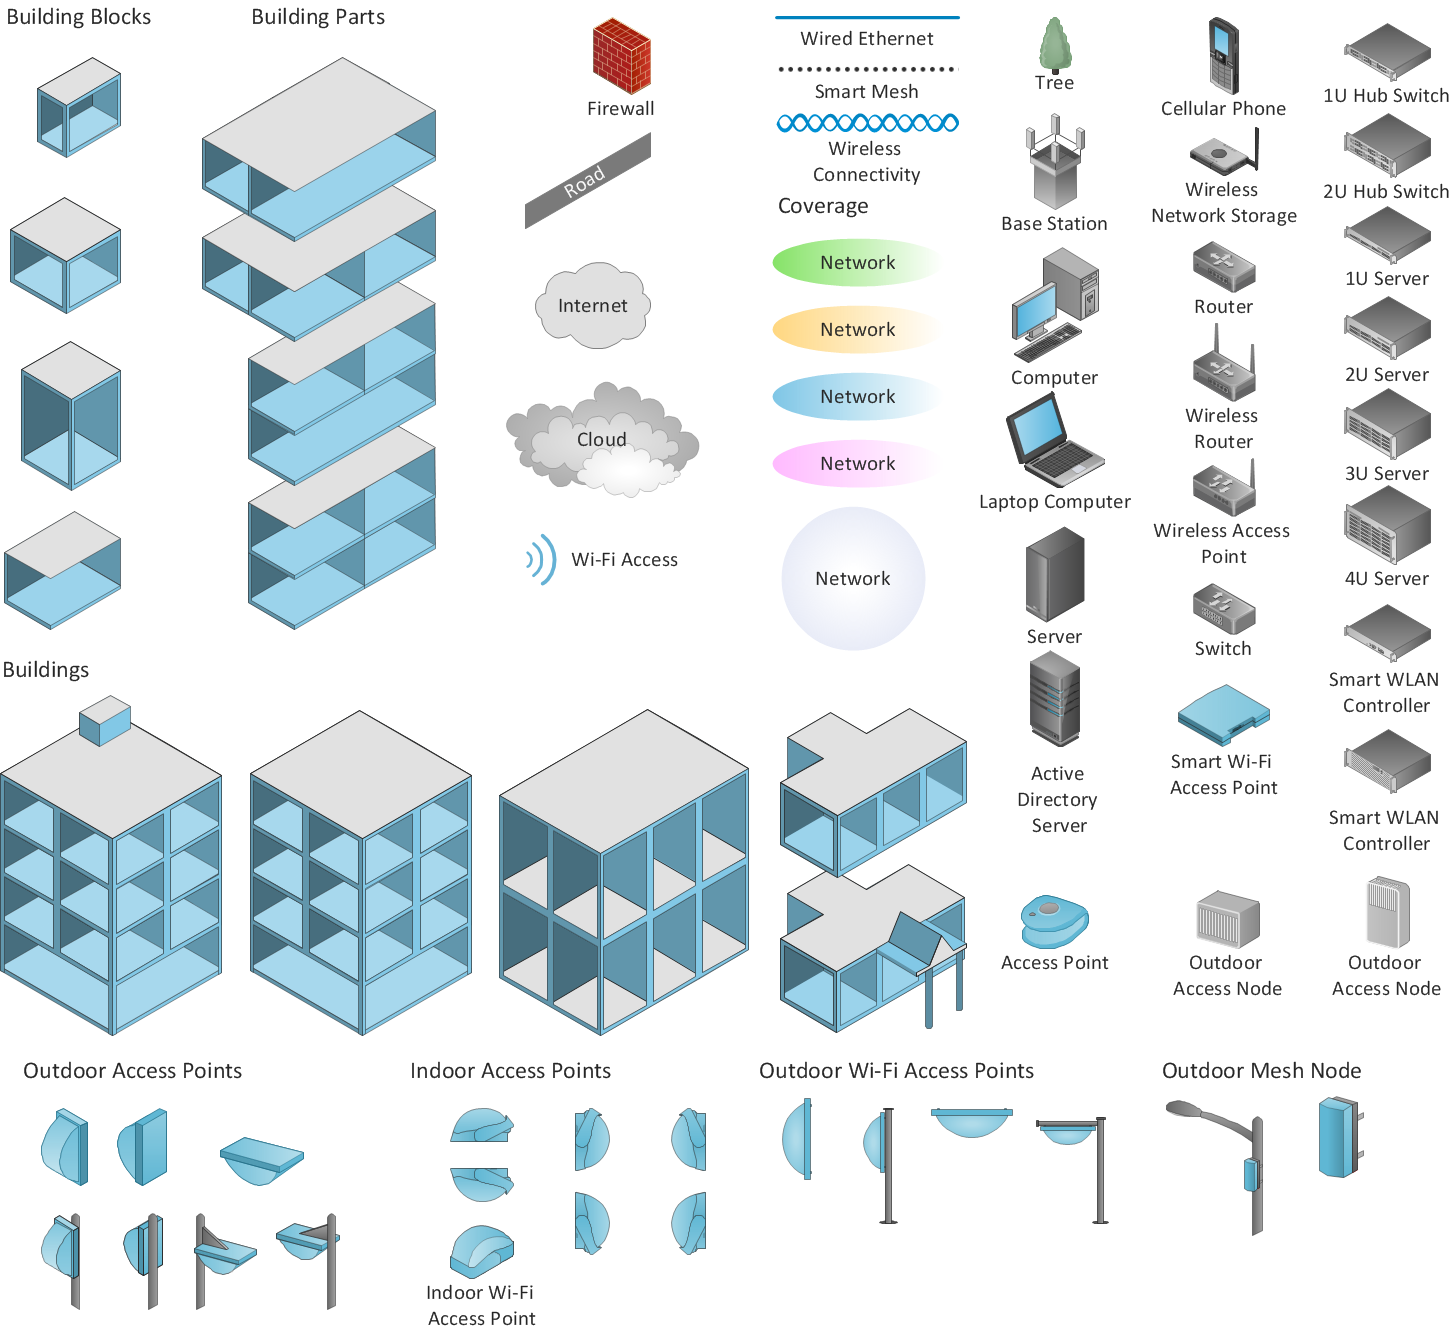
Wireless Network Diagram Examples
Improving Problem Solving and Focus with Fishbone Diagrams

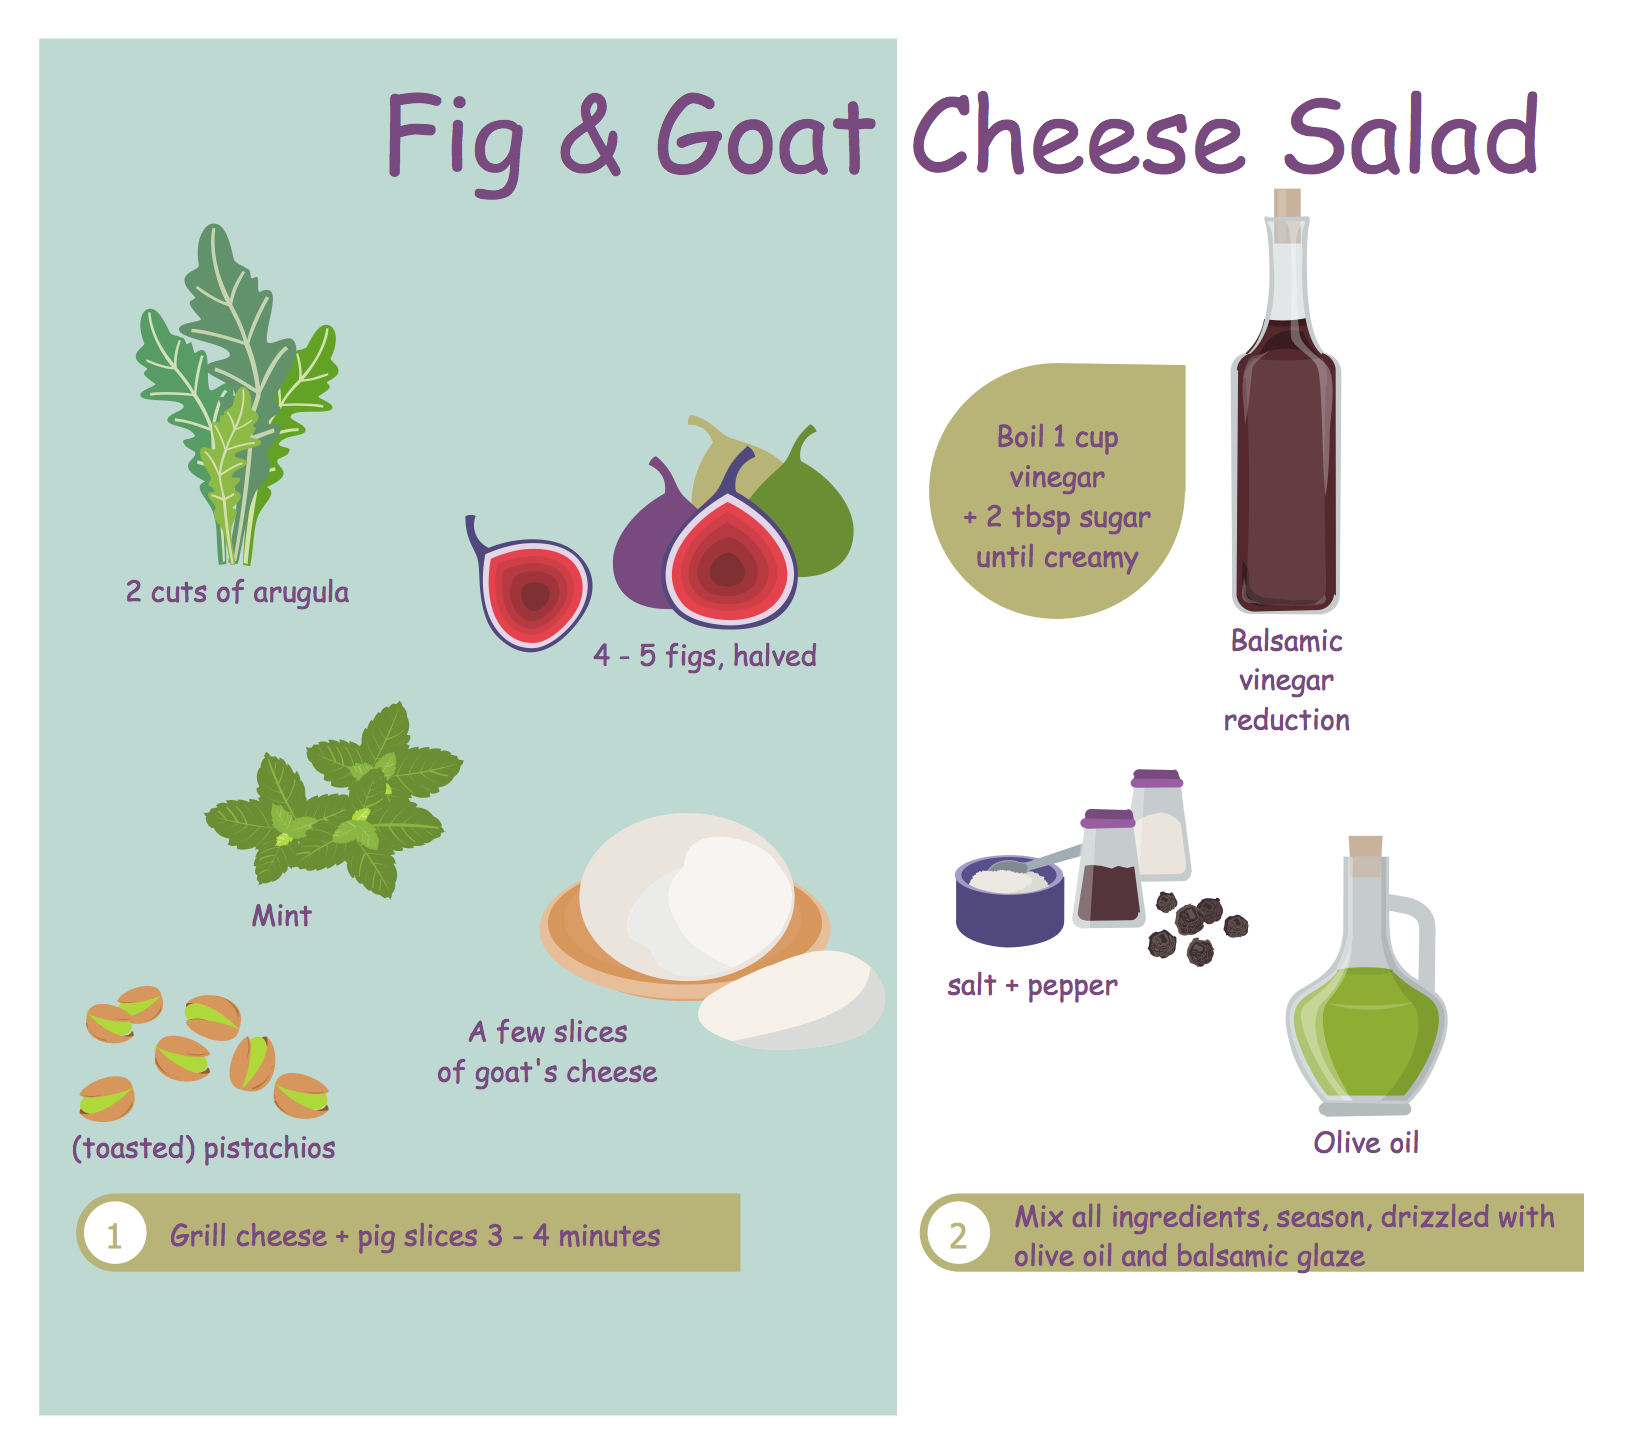
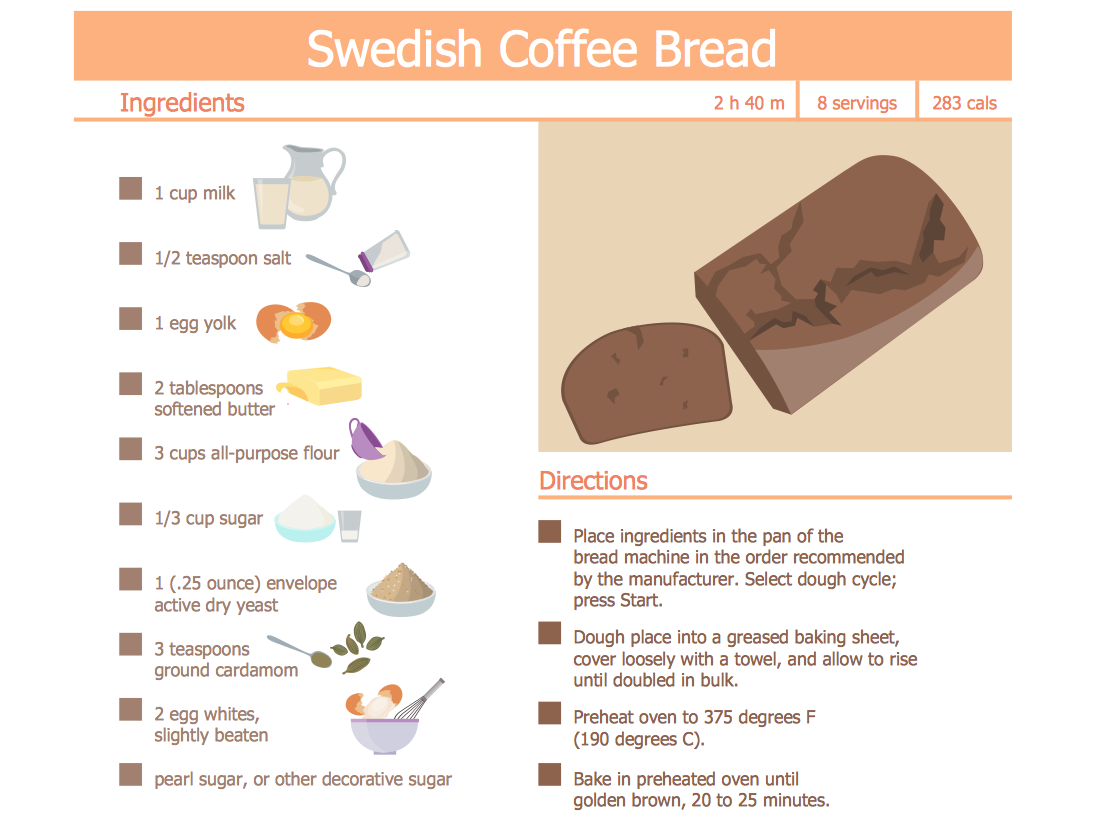
Food Recipes
Modelling Complex Events with Event-Driven Process chain

Fishbone Diagram
Sales Growth. Bar Graphs Example

Cooking Recipes
 Cross-Functional Flowcharts
Cross-functional flowcharts are powerful and useful tool for visualizing and analyzing complex business processes which requires involvement of multiple people, teams or even departments. They let clearly represent a sequence of the process steps, the order of operations, relationships between processes and responsible functional units (such as departments or positions).
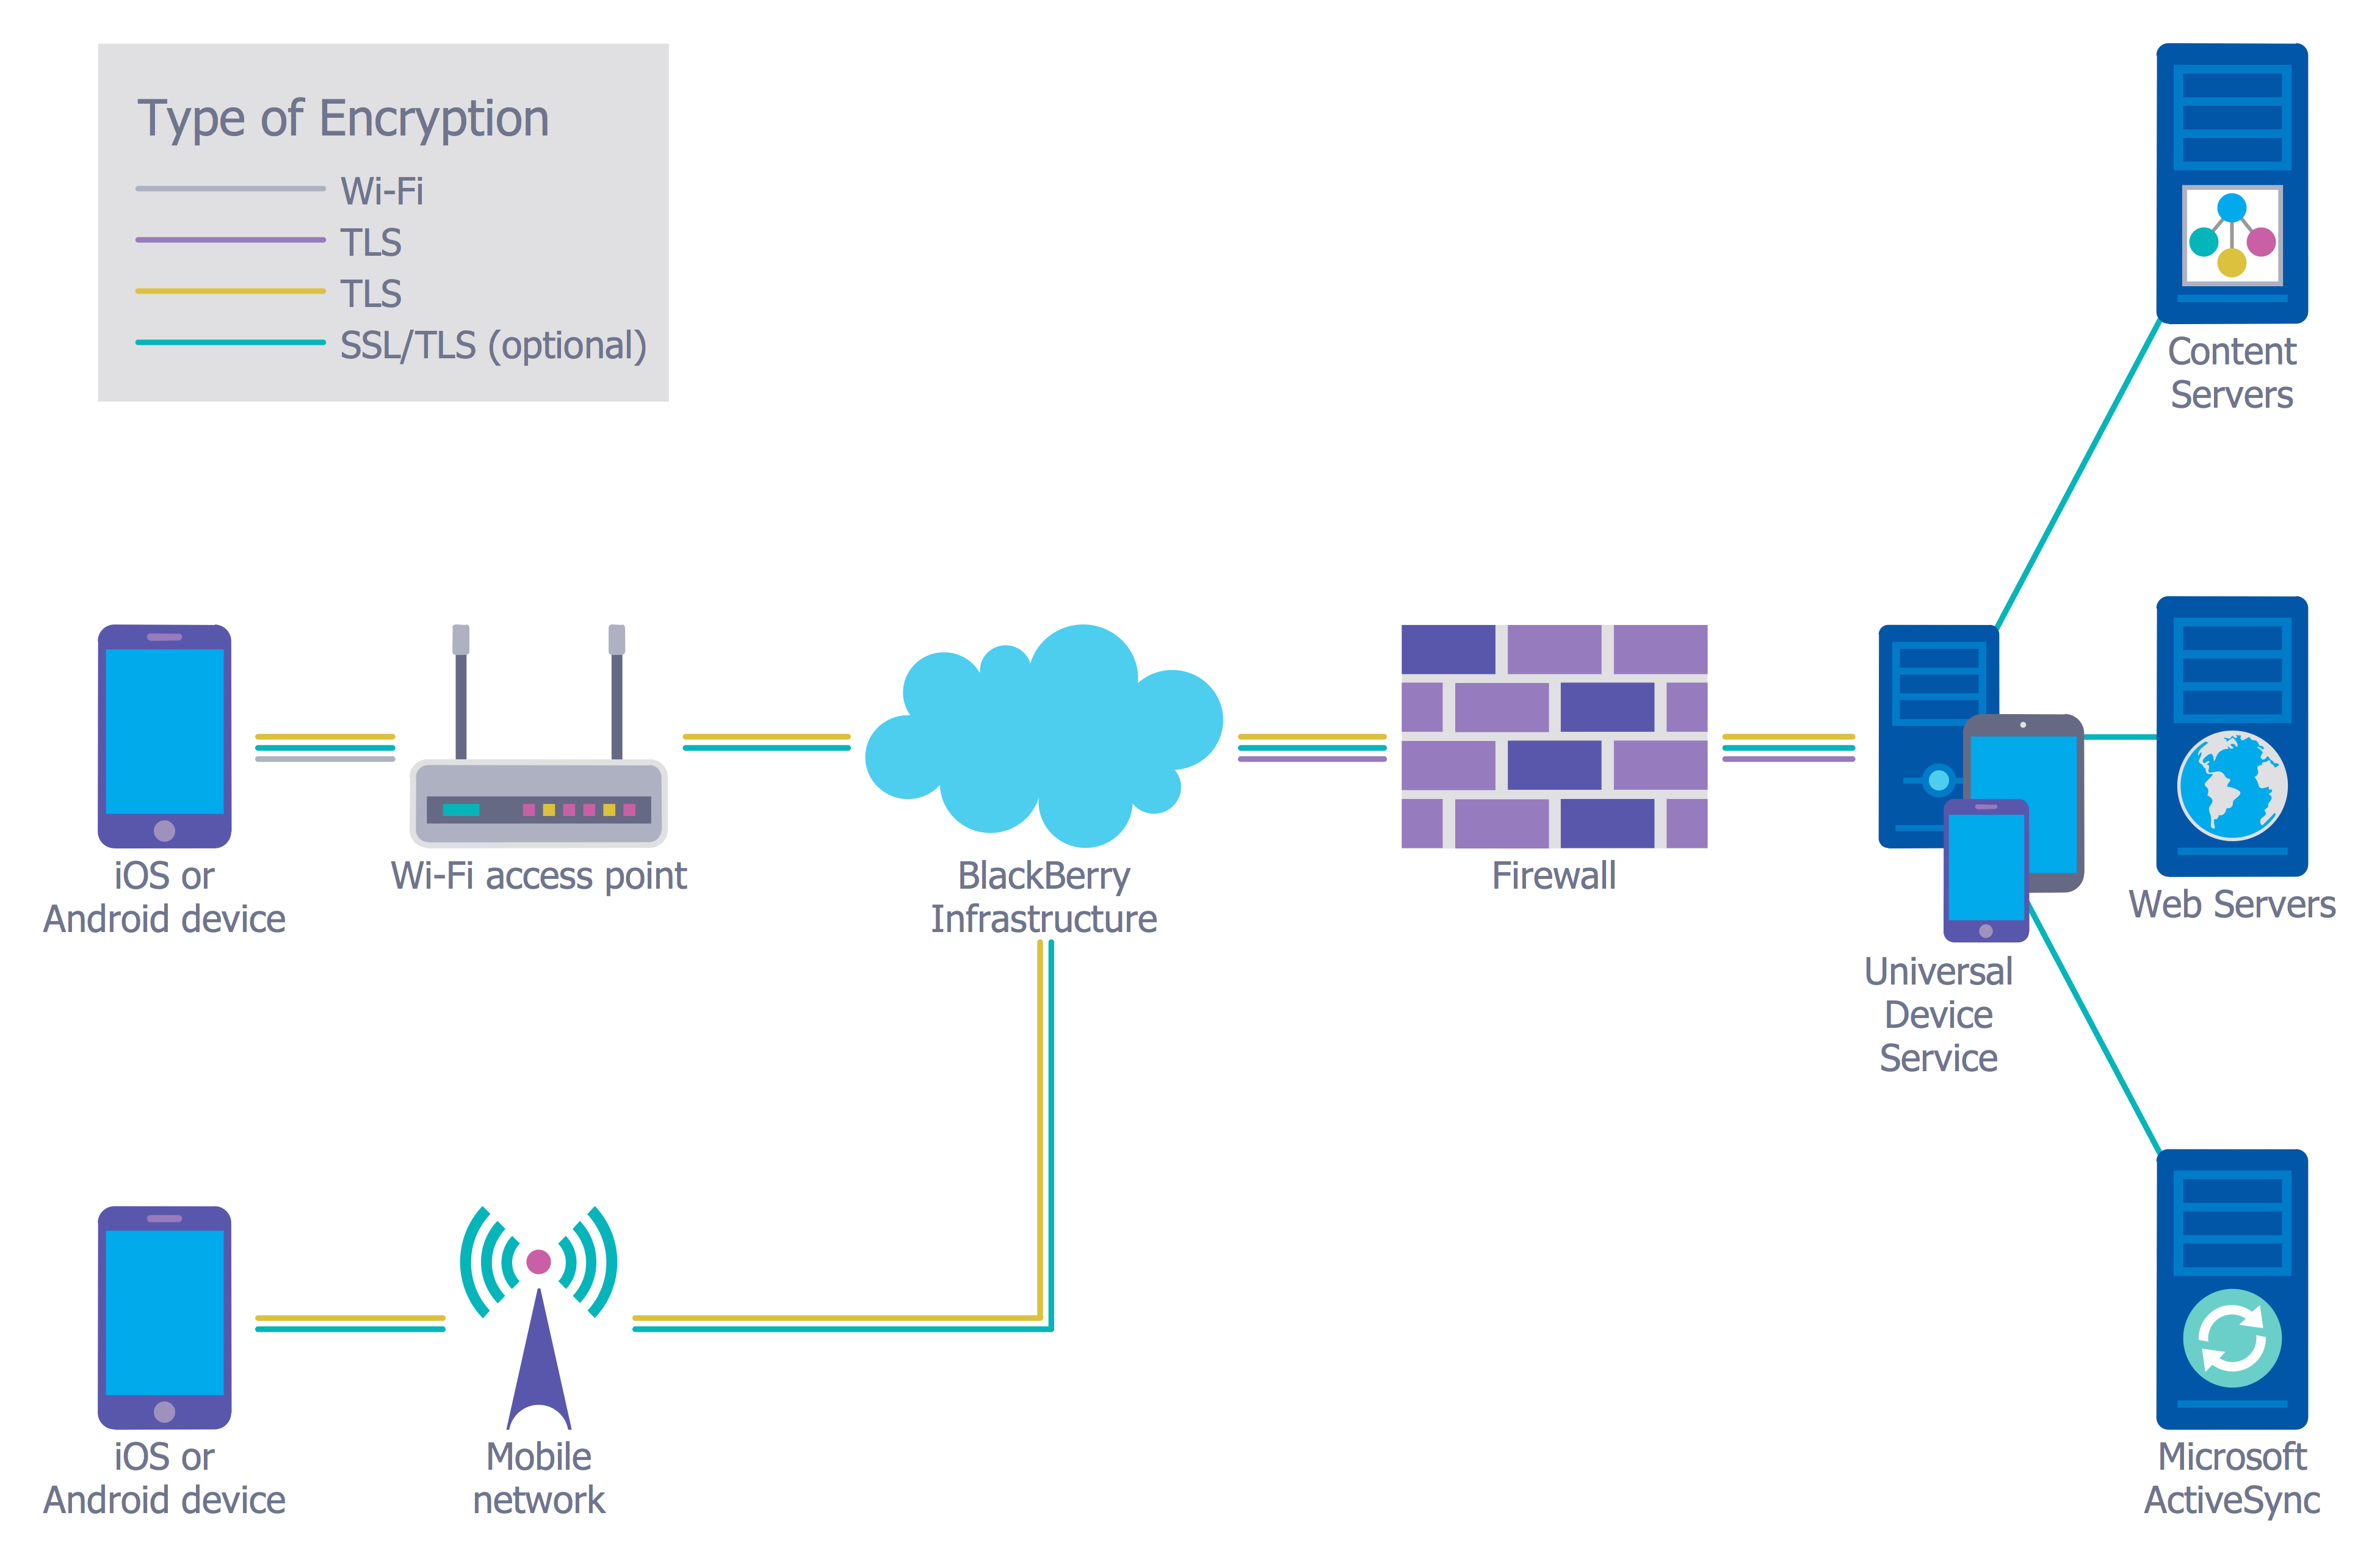
Network Security
- Examples Of Small Coffee Shop Floor Plans
- Entity-Relationship Diagram (ERD) | Café Floor Plan Example ...
- Example Of Organogram For Coffee Shop
- Fishbone diagram - Bad coffee | Fishbone Diagrams | Building ...
- Cafe and Restaurant Floor Plans | Coffee shop floor plan | Café ...
- Example Of Layout For Building Coffee Shop
- Cafe and Restaurant Floor Plans | Café Floor Plan Example | Cafe ...
- Organizational Chart Sample Of Coffee Shop
- Plant Layout Of A Coffee Shop
- How To Create Restaurant Floor Plan in Minutes | Coffee Shop ...
- Coffee shop floor plan | Coffeehouse plan | How To use House ...
- Fishbone diagram - Bad coffee | Fishbone Diagram Problem Solving ...
- Example Of Business Process Design Coffee Shop
- Wireless Network Diagram Examples | Cafe and Restaurant Floor ...
- Fishbone diagram - Bad coffee | Personal area (PAN) networks ...
- UML Use Case Diagram Example Social Networking Sites Project ...
- Fishbone diagram - Bad coffee | Coffee shop floor plan | Office ...
- Cafe and Restaurant Floor Plans | Café Floor Plan Example ...
- Total Quality Management Value | Fishbone diagram - Bad coffee ...
- Cisco Design | Sales Growth. Bar Graphs Example | Structured ...