This site uses cookies. By continuing to browse the ConceptDraw site you are agreeing to our Use of Site Cookies.

entity-relationship diagram, ER-diagram, database ERD Entity-Relationship Diagram (ERD)

entity-relationship diagram, ER-diagram, database ERD
An Entity-Relationship Diagram (ERD) is a visual presentation of entities and relationships. That type of diagrams is often used in the semi-structured or unstructured data in databases and information systems. At first glance ERD is similar to a flowch

Entity Relationship Diagram Symbols

The semantic modeling method nowadays is successfully applied in database structure design. It is effective method of modeling the data structures, which is based on the meaning of these data. As a tool of semantic modeling, there are used different types of Entity-Relationship Diagrams. Entity Relationship Diagram (ERD) is applied to visually and clearly represent a structure of a business database. The main components of ERDs are: entity, relation and attributes. An entity is a class of similar objects in the model, each entity is depicted in the form of rectangle and has the name expressed by a noun. Relation is shown in the form of non-directional line that connects two entities. There are several notation styles used for ERDs: information engineering style, Chen style, Bachman style, Martin Style. The Entity Relationship Diagram symbols used for professional ERD drawing are predesigned by professionals and collected in the libraries of the Entity-Relationship Diagram (ERD) solution for ConceptDraw DIAGRAM software.

Entity Relationship Diagram Examples

Creation of Entity-Relationship (ER) model is a visual representation the structure of a business database, where data equates to entities or objects, which are linked by defined relationships expressing dependencies and requirements. By the nature, the ER model is an abstract visualization, a first step in design process towards creating a logical and functional database. ConceptDraw DIAGRAM professional software gives the ability to effectively describe a database using the Entity-Relationship model. Included to ConceptDraw Solution Park, the Entity-Relationship Diagram (ERD) solution contains the set of predesigned vector icons advocated by Chen's and Crow’s Foot notations that both can be used for data modeling and describing a database. Entity-Relationship Diagram (ERD) solution includes also helpful templates and incredibly large collection of varied Entity Relationship Diagram examples and samples offered at ConceptDraw STORE. Each of them can be used to develop your own model of a database of arbitrary complexity.
How to Build an Entity Relationship Diagram (ERD)

UML Class Diagram Generalization Example UML Diagrams

This sample was created in ConceptDraw DIAGRAM diagramming and vector drawing software using the UML Class Diagram library of the Rapid UML Solution from the Software Development area of ConceptDraw Solution Park. This sample describes the use of the classes, the generalization associations between them, the multiplicity of associations and constraints. Provided UML diagram is one of the examples set that are part of Rapid UML solution.

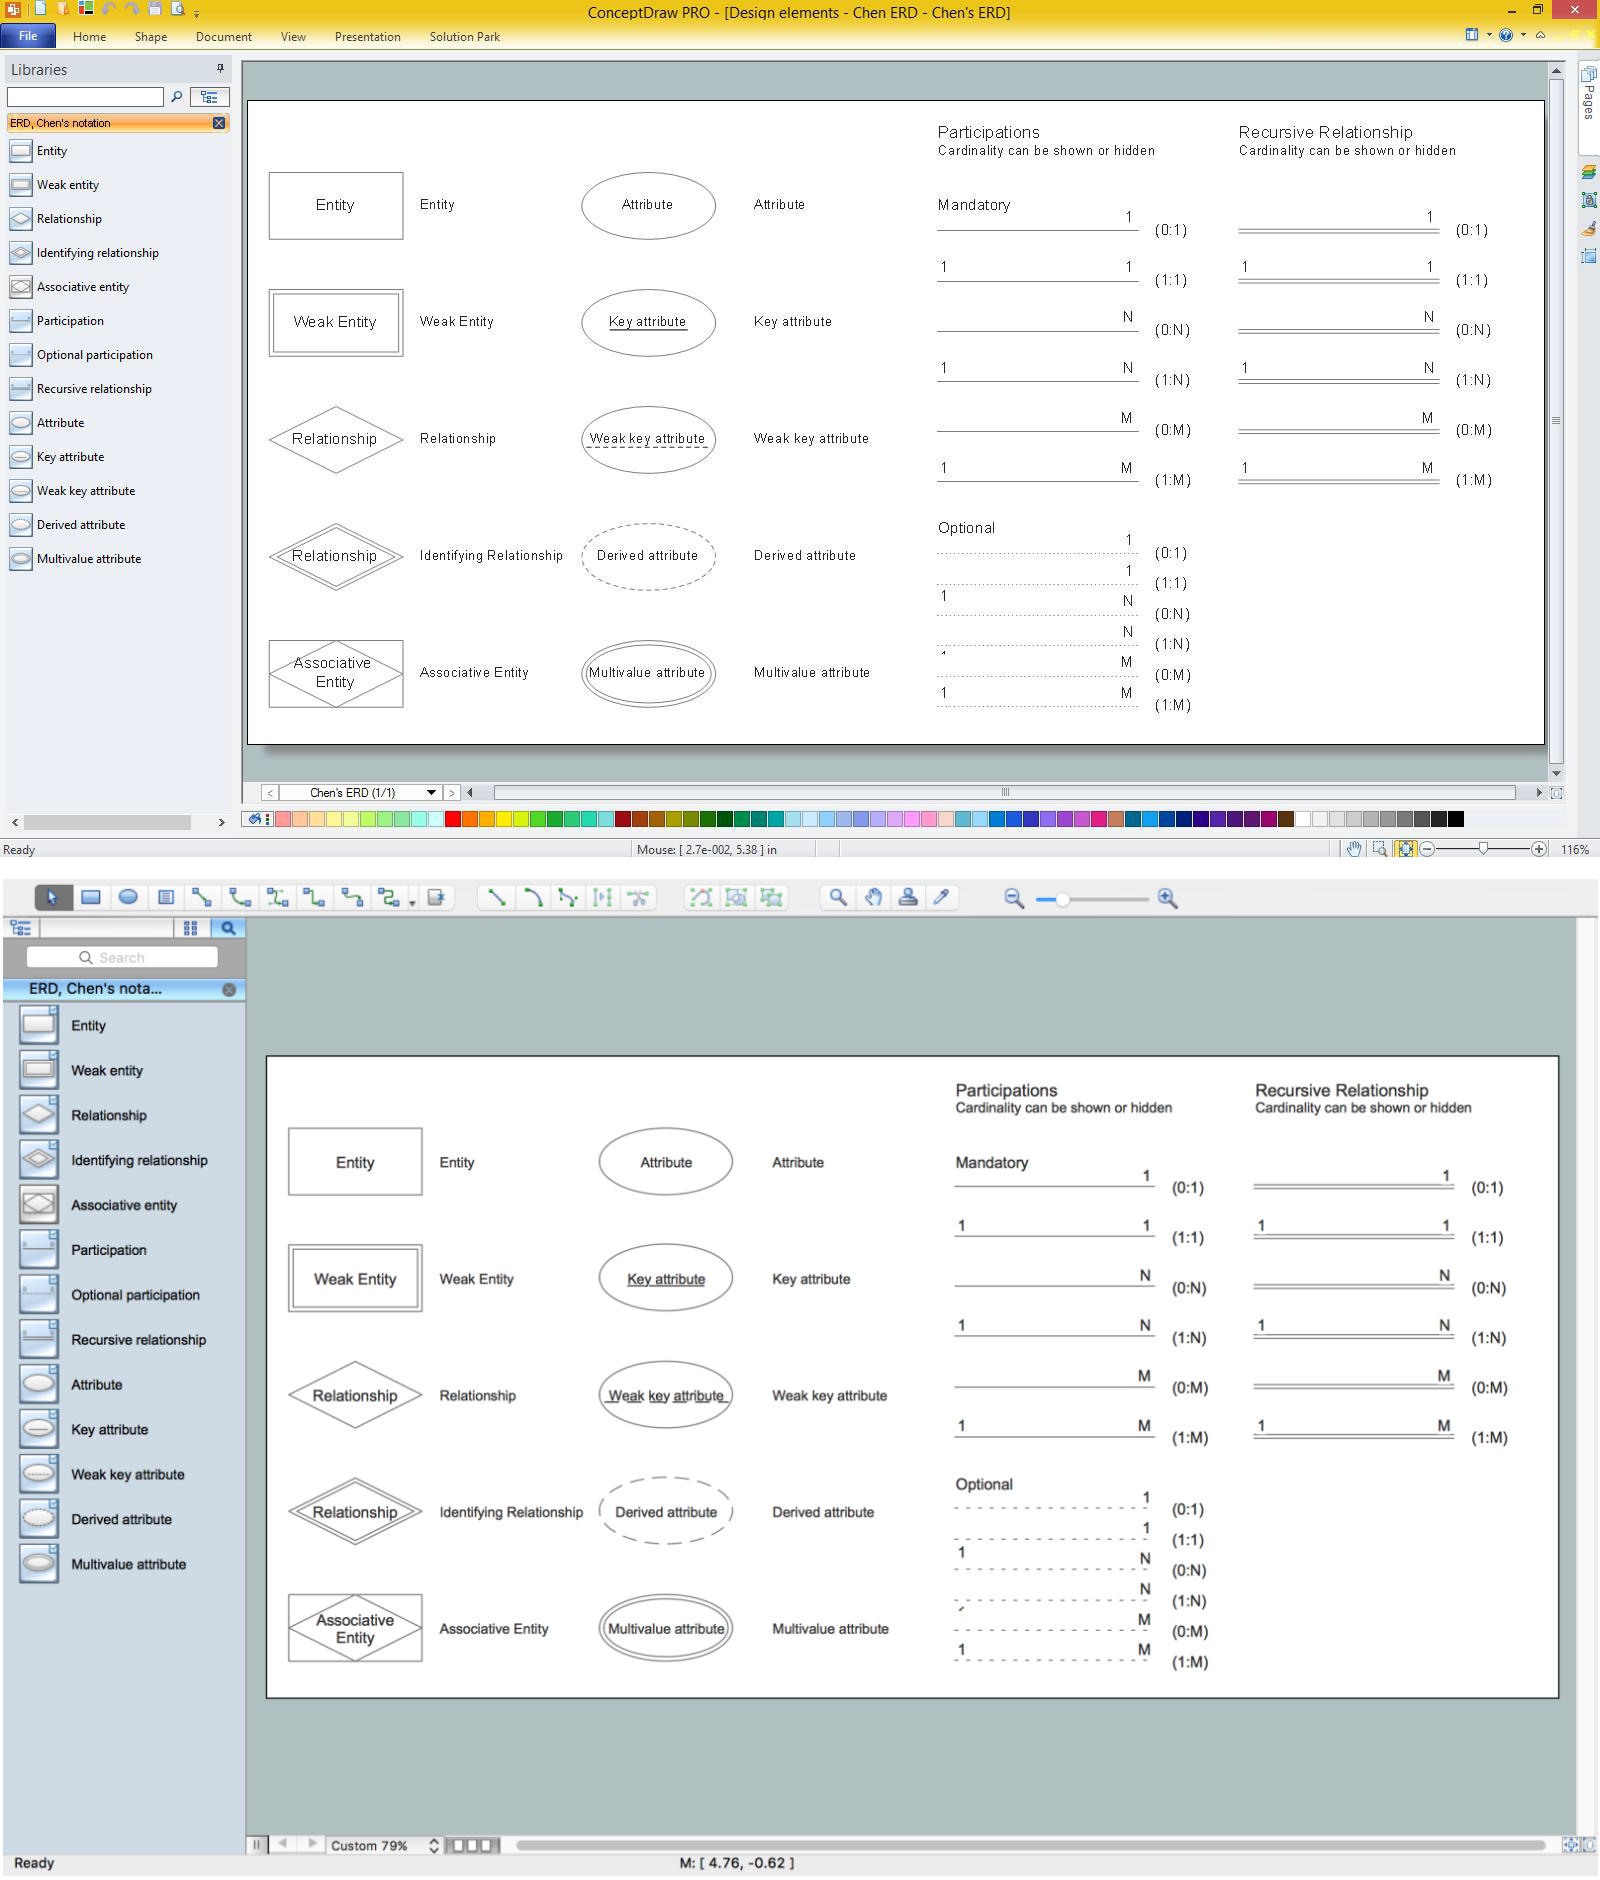
Entity Relationship Diagram - ERD - Software for Design Chen ER Diagrams

The Entity-Relationship Diagram (ERD) solution from ConceptDraw Solution Park extends ConceptDraw DIAGRAM ector graphics and diagramming software with the ability to describe a database using the Entity-Relationship (Chen) model. Use it for design your ERDs and verify that ConceptDraw DIAGRAM offers the best ERD diagrams software tools for design element Chen notation.

ER Diagram Tool

Creating of Entity-Relationship Diagrams (ERDs) is a complex process that requires convenient, automated tools. ConceptDraw DIAGRAM diagramming and vector drawing software offers a powerful ER Diagram Tool - the Entity-Relationship Diagram (ERD) Solution from the Software Development Area.

Design Element: Chen for Entity Relationship Diagram - ERD

Entity-Relationship Diagrams (ERDs) were developed and introduced as a convenient and visual tool for the data modeling, they are the perfect way for easy determining data and also relationships between them. The first standard notation for ERD was proposed by Chen. Chen's notation is very rich on the data modeling tools and standard notation symbols and elements for drawing easy understandable Entity-relationship diagrams, Attribute diagrams, Decomposition charts, which are especially popular for designing relational databases. The entity is the main term, it is a set of instances abstract or real objects with common characteristics or attributes. Any system's object is represented by one uniquely identified entity, relationships describe the links between the entities. ConceptDraw DIAGRAM diagramming software, which includes the Entity-Relationship Diagram (ERD) solution, offers all needed tools for professional drawing ER diagrams. Specially developed vector ERD design elements according to Chen and Crow's Foot notations are indispensible for professional ERDs design.

Design Element: Crows Foot for Entity Relationship Diagram - ERD

Entity-Relationship Diagram (ERD) is ideal tool that helps execute the detalization of data warehouse for a given designed system, lets to document the system's entities, attributes (objects' properties), and their interactions each other (relationships). Creation of an ERD requires the choice of specific set of notations, which the best suits for your database design. Two notations - Chen’s and Crow's Foot are applied for ERDs design. Chen's notation was developed first and has linguistic approach, the boxes represent the entities and are considered as nouns, relationships between them are shown as diamonds in a verb form. Over time Chen’s style was adapted into the popular standard - Crow’s Foot notation, where entities are shown as boxes and relationships - as labeled lines. ConceptDraw DIAGRAM software supplied with Entity-Relationship Diagram (ERD) solution offers samples and templates of ER diagrams, and also ready-to-use vector design elements - ERD Crow′s Foot and Chen's notation icons for easy designing your own ER diagrams for depicting databases.

Flowchart

The Flowcharts are widespread in various fields and include the multitude of types. They are dedicated to representation the algorithms, processes, workflows of any complexity in a clear and intuitive format. The Flowcharts are commonly used in software development as a visual tool for illustration algorithms and logic of computer programs, in business for illustration business scenarios, in education, and so on. For drawing the Flowchart are used the special object blocks, among them rectangle or box used to represent an activity or step, rounded box or oval to depict Start / End, diamond to represent the decision point (involves the branching yes/no), circle used to represent the point of connection, parallelogram to represent the Input / Output, and some others. With ConceptDraw DIAGRAM including Flowcharts solution it is easy to create professional-looking Flowchart diagrams of any complexity and any degree of detailing. Succeed in drawing the Flowcharts using quick-start templates, predesigned samples and extensive libraries of ready-made flowchart symbols, blocks and icons.

Business process Flow Chart — Event-Driven Process chain (EPC) diagrams

Event-Driven Process chain Diagrams for improvement throughout an organisation. Best software for Process Flow Diagram. The Event-driven Process Chain (EPC) Diagrams allows managers to plan processes and resources.