Entity Relationship Diagram Software

Entity Relationship Diagram Software Engineering

Entity Relationship Diagram Examples


ERD Symbols and Meanings

Event-Driven Process Chain Diagram Software
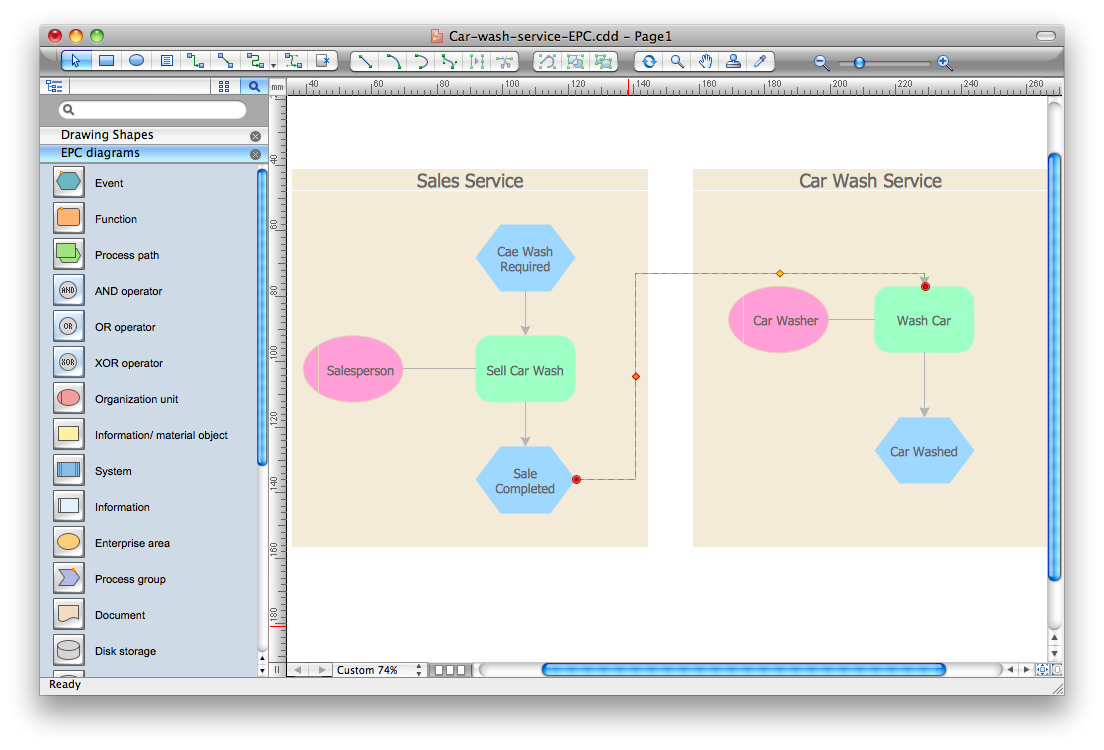
Business process Flow Chart — Event-Driven Process chain (EPC) diagrams

Data Flow Diagram Process

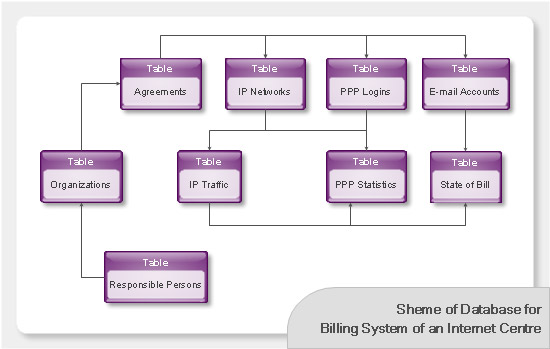
Databases Access Objects Model with ConceptDraw DIAGRAM
An Event-driven Process Chain (EPC) - flowchart used for business process modelling

The business processes modeling (BPM) flowchart sample "Event-driven process chain (EPC) diagram" was created on the base of illustration from "Methods for the specification and verification of business processes. 19 - Event-driven process chains. Roberto Bruni. 2011".
"An Event-driven Process Chain (EPC) is a
particular type of flow-chart that can be used for configuring an Enterprise Resource Planning (ERP) implementation.
Supported by many tools (e.g. SAP R/ 3).
EPC Markup Language available (EPML)
as interchange format. ...
EPC overview.
Important notation to model the domain aspects of business processes.
Rather informal notation.
EPC focus is on representing domain concepts and processes (not their formal aspects and technical realization).
It can be used to drive the modeling, analysis and redesign of business process." [cli.di.unipi.it/ ~rbruni/ MPB-12/ 19-EPC.pdf]
The event-driven process chain (EPC) diagram example was drawn using the ConceptDraw PRO diagramming and vector drawing software extended with the Event-driven Process Chain Diagrams solution from the Business Processes area of ConceptDraw Solution Park.
EPC flow chart
-diagram.png--diagram-flowchart-example.png)
- Er Diagram For Erp System
- Erp Erd
- Entity-Relationship Diagram ( ERD ) | Fishbone Diagram | Accounting ...
- Entity-Relationship Diagram ( ERD ) | Event-driven Process Chain ...
- Dfd And Erd Of Erp System For College
- Entity-Relationship Diagram ( ERD ) | Erp Diagram Examples
- Erp Diagram
- College Erp System
- Entity-Relationship Diagram ( ERD ) | Crow's Foot Notation | Entity ...
- Entity-Relationship Diagram ( ERD ) | Different Symbols Used In Erp ...