 Entity-Relationship Diagram (ERD)
An Entity-Relationship Diagram (ERD) is a visual presentation of entities and relationships. That type of diagrams is often used in the semi-structured or unstructured data in databases and information systems. At first glance ERD is similar to a flowch
Technical Drawing Software

Cloud Computing Architecture Diagrams

 PM Presentations
The PM Presentations solution extends the power of ConceptDraw MINDMAP , ConceptDraw DIAGRAM , and ConceptDraw PROJECT, improving their efficiency at many stages of the project management process by using the same source data to construct the targeted presentation for your audience and clearly communicating the appropriate information to different audiences from a single source. It gives an ability to project managers and other team participants to create and to deliver capacious presentations representing the data and knowledge of a specific project with the help of including visual dashboards, Gantt charts, resource views, maps, timelines, calendars, illustrations, project diagrams and reports of varied types. Having the possibility to edit collaboratively in a Full-Screen Mode, the teams can rapidly plan a project as well as execute the tasks of revising and making changes to it.
Circuits and Logic Diagram Software

 Fault Tree Analysis Diagrams
This solution extends ConceptDraw DIAGRAM.5 or later with templates, fault tree analysis example, samples and a library of vector design elements for drawing FTA diagrams (or negative analytical trees), cause and effect diagrams and fault tree diagrams.
 Enterprise Architecture Diagrams
Enterprise Architecture Diagrams solution extends ConceptDraw DIAGRAM software with templates, samples and library of vector stencils for drawing the diagrams of enterprise architecture models.
HelpDesk
How to Create an Entity-Relationship Diagram

 Football
The Football Solution extends ConceptDraw DIAGRAM.5 (or later) software with samples, templates, and libraries of vector objects for drawing football (American) diagrams, plays schemas, and illustrations. It can be used to make professional looking documen
 Interactive Voice Response Diagrams
Interactive Voice Response Diagrams solution extends ConceptDraw DIAGRAM software with samples, templates and libraries of ready-to-use vector stencils that help create Interactive Voice Response (IVR) diagrams illustrating in details a work of interactive voice response system, the IVR system’s logical and physical structure, Voice-over-Internet Protocol (VoIP) diagrams, and Action VoIP diagrams with representing voice actions on them, to visualize how the computers interact with callers through voice recognition and dual-tone multi-frequency signaling (DTMF) keypad inputs.
 Presentation Exchange
This solution extends ConceptDraw MINDMAP software with the ability to import presentations from Microsoft PowerPoint, as well as enhancing its existing presentation capabilities.
 Nature
This solution extends ConceptDraw DIAGRAM software with samples, templates and libraries of vector clipart for drawing the Nature illustrations. Use it to make professional-looking documents, presentations and websites illustrated with color scalable vector c
 Area Charts
Area Charts are used to display the cumulative totals over time using numbers or percentages; or to show trends over time among related attributes. The Area Chart is effective when comparing two or more quantities. Each series of data is typically represented with a different color, the use of color transparency in an object’s transparency shows overlapped areas and smaller areas hidden behind larger areas.
 Project Exchange
This solution extends ConceptDraw PROJECT and ConceptDraw MINDMAP software with the ability to import and export project data.
HelpDesk
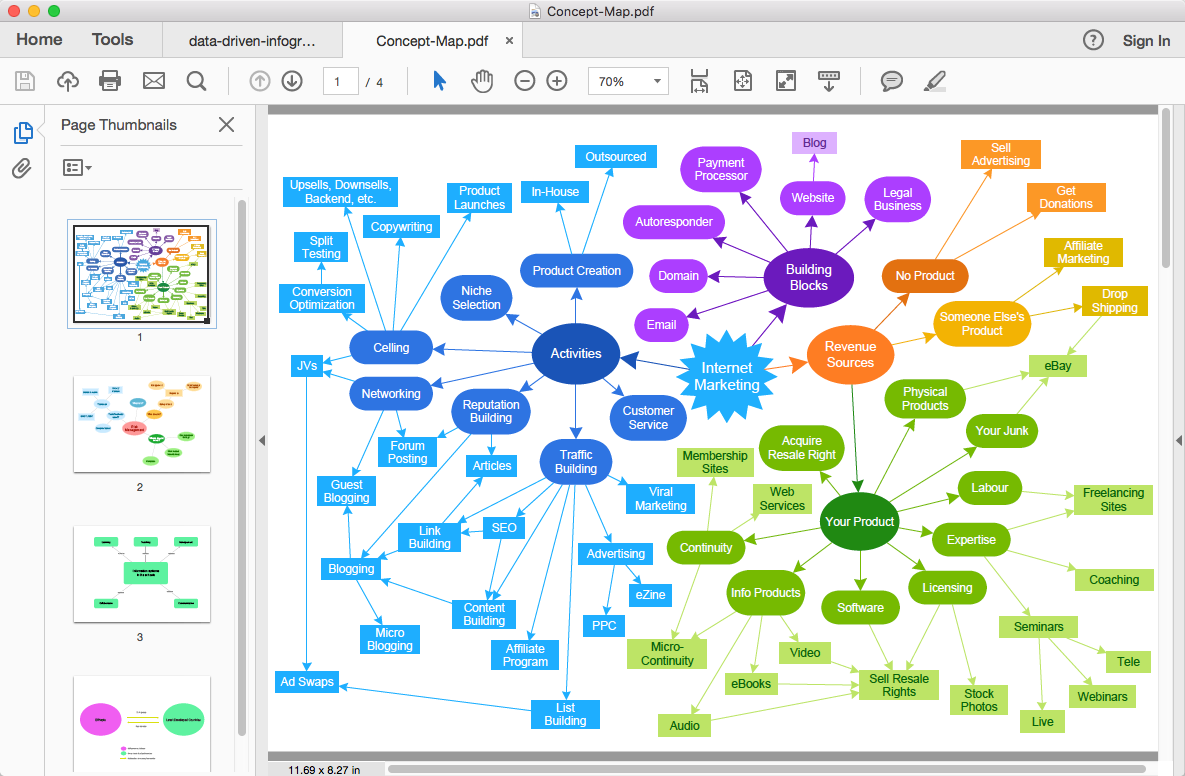
How To Convert a Concept Map to Adobe PDF
- Dfd Restaurant Management System
- Dfd Restorants Management System Pdf
- Erd And Dfd Of Resturant Management System
- Erd Diagram For Restaurant Management System
- Er Diagram For Restaurant Management System Pdf
- Ppt Of Dfd For Restaurant Management
- Dfd About Restaurant Project Pdf
- Simple Library Management System Database With Er Diagram In Pdf
- Database Diagram Tool | Entity-Relationship Diagram ( ERD ) with ...
- Human Resource Management System Ppt Presentation With Uml
- Dfd For Net Cafe Management Pdf
- Er Diagram For Restaurant Management Uml
- Data Flow Diagram Ppt For Event Management System
- Er Diagram For Event Management System Pdf
- Dfd Diagram For Restaurant Management System
- Library Management System Dfd Download
- Dfd Diagram For Restaurant Management System In Software
- Sequence Diagrams For Restaurant Management System
- Data Flow Diagram Of Event Management System On Pdf
- Er Diagram For Library Management System Crows Foot Notation