Data Modeling with Entity Relationship Diagram

This ERD example was designed on the base of the entity-relationship diagram on the webpage "IS480 Team wiki: 2015T1 WhitePinnacle Documentation" from the Singapore Management University website. [wiki.smu.edu.sg/ is480/ IS480_ Team_ wiki%3A_ 2015T1_ WhitePinnacle_ Documentation]
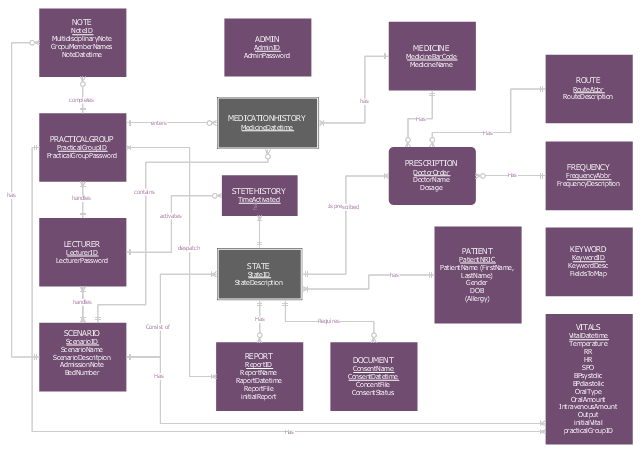
This is ERD from the documentation of the High School Emergency Medical Responder (HS EMR) information system.
"Emergency medical responders are people who are specially trained to provide out-of-hospital care in medical emergencies. There are many different types of emergency medical responders, each with different levels of training, ranging from first aid and basic life support. Emergency Medical Responders have a very limited scope of practice and have the least amount of comprehensive education, clinical experience or clinical skills of EMS personnel. The Emergency Medical Responder (EMR) is not meant to replace the roles of Emergency Medical Technicians, Emergency Medical Technologists or Paramedics and their wide range of specialities. Emergency Medical Responders typically assist in rural regions providing basic life support where pre-hospital health professionals are not available due to limited resources or infrastructure." [Emergency medical responder. Wikipedia]
The example "Entity-Relationship Diagram" was drawn using ConceptDraw PRO software extended with the Entity-Relationship Diagram (ERD) solution from the Software Development area of ConceptDraw Solution Park.
ERD
Stakeholder Management System

UML Class Diagram Generalization Example UML Diagrams

E-R Diagrams

UML Class Diagram Notation

Data Flow Diagrams

Entity Relationship Diagram Software for Mac

DFD Flowchart Symbols

Flowchart Components

- Entity - Relationship Diagram (ERD) | Database Schema Diagram For ...
- Er Diagram For Medical Store Management System
- Entity - Relationship Diagram (ERD) | Online Payment System E R ...
- Erd Diagrams Of E Healthcare System
- Er Diagram For Shop Management System
- Healthcare Management System Er Diagram
- Er Diagram For Healthcare Management System
- Entity - Relationship Diagram (ERD) | Online Store Management Erd
- Er Digram Of Health Card
- Er Diagram For Solar System Management