This site uses cookies. By continuing to browse the ConceptDraw site you are agreeing to our Use of Site Cookies.

entity-relationship diagram, ER-diagram, database ERD Entity-Relationship Diagram (ERD)

entity-relationship diagram, ER-diagram, database ERD
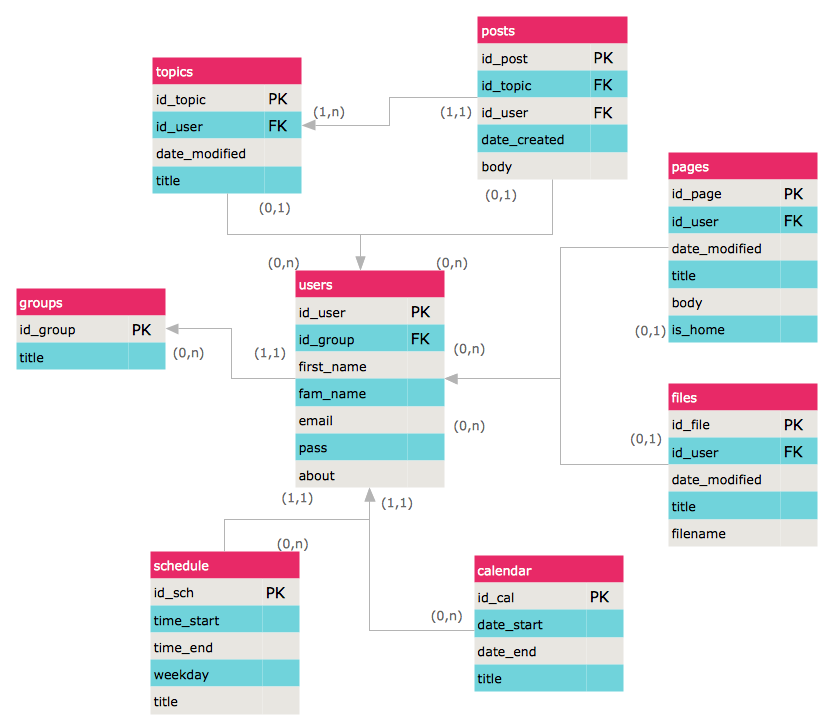
An Entity-Relationship Diagram (ERD) is a visual presentation of entities and relationships. That type of diagrams is often used in the semi-structured or unstructured data in databases and information systems. At first glance ERD is similar to a flowch

calendar templates Calendars

calendar templates
Calendars solution extends ConceptDraw DIAGRAM software with templates, samples and library of vector stencils for drawing the business calendars and schedules.

Entity-Relationship Diagram (ERD) with ConceptDraw DIAGRAM

Entity-Relationship Diagram (ERD) serves for detailed description of structures and databases. An ERD represents a diagram made up mainly of rectangular blocks (for entities, or data) linked with relationships. The links between the blocks describe relations between these entities. There are three types of relationships: one-to-one,
one-to-many, many-to-many.
Draw Entity-Relationship Diagrams (ERD) easily with ConceptDraw extended with Entity-Relationship Diagram (ERD) Solution from the Software Development Area. Use ERD software to create ER diagram.
How to Build an Entity Relationship Diagram (ERD)

Data Modeling with Entity Relationship Diagram

Data modeling is actively applied in analysis and uses wide set of methods for description the data requirements in a system. One of the most popular and well-known is the ERD method of database modeling.
The best ERD tool for the Mac and Windows is ConceptDraw DIAGRAM software extended with the Entity-Relationship Diagram (ERD) solution from the Software Development Area for ConceptDraw Solution Park, which is sharpened for professional ERD drawing and data modeling with Entity Relationship Diagram.

Entity Relationship Diagram Examples

Creating an entity-relationship (ER) model is to visually represent the structure of a business database, where data equates to entities (or objects) that are linked by defined relationships expressing dependencies and requirements. By nature it is an abstract visualization, the first step in the design process towards creating a logical and functional database.
ConceptDraw gives the ability to describe a database using the Entity-Relationship model. Entity-Relationship Diagram solution includes icons advocated by Chen's and Crow’s Foot notation that can be used when describing a database.
How to Build an Entity Relationship Diagram (ERD)
HelpDesk

How to Create an Entity-Relationship Diagram

ERD (entity relationship diagram) is used to show the logical structure of databases. It represents the interrelationships between components of a database (entities). Entity relationship diagrams are widely used in software engineering. Using ERD software engineers can control every aspect of database development. ER diagram can be used as a guide for testing and communicating before the release of the software product. ERD displays data as entities that are connected with connections that show the relationships between entities. There are some ERD notations used by databases developers for representing the relationships between the data objects. ConceptDraw DIAGRAM and its ERD solution allow you to build ERD diagram of any notation.

Entity Relationship Diagrams

The Entity-Relationship Diagram (ERD) Solution from the Software Development Area for ConceptDraw Solution Park extends ConceptDraw DIAGRAM vector graphics and diagramming software with the ability of drawing the Entity Relationship Diagrams for visually describing the databases with Crow’s Foot and Chen's notation icons.

EXPRESS data modeling language, data modeling tools, database diagram tool, database design tool, Database Model Diagram, EXPRESS-G data Modeling Diagram

EXPRESS data modeling language, data modeling tools, database diagram tool, database design tool, Database Model Diagram,
EXPRESS-G data Modeling Diagram solution extends the ConceptDraw DIAGRAM software functionality with capabilities of EXPRESS data modeling language, includes powerful data modeling tools, Express-G diagram tool, database diagram tool, database design tool, wide variety of pre-made vector objects of EXPRESS-G notation and EXPRESS-G diagrams samples allowing software developers, software designers, software engineers and other stakeholders to make their data models for information systems, to develop the databases, to learn the principles of construction EXPRESS-G diagrams and helping to draw their own EXPRESS-G Data Modeling Diagrams, Express-G Diagrams or Database Model Diagram without any efforts.

data flow diagram, DFD templates Data Flow Diagrams (DFD)

data flow diagram, DFD templates
Data Flow Diagrams solution extends ConceptDraw DIAGRAM software with templates, samples and libraries of vector stencils for drawing the data flow diagrams (DFD).

Business Process Mapping — How to Map a Work Process

ConceptDraw DIAGRAM is a world-class diagramming platform that lets you display, communicate, and present dynamically. It′s powerful enough to draw everything from basic flowcharts to complex engineering schematics.
Video tutorials on ConceptDraw products. Try it today!