 Entity-Relationship Diagram (ERD)
An Entity-Relationship Diagram (ERD) is a visual presentation of entities and relationships. That type of diagrams is often used in the semi-structured or unstructured data in databases and information systems. At first glance ERD is similar to a flowch
Entity-Relationship Diagram (ERD) with ConceptDraw DIAGRAM


 Chen Notation
The Chen Notation solution extends ConceptDraw DIAGRAM software with rich collection of ERD samples and selection of special Chen's notation icons for effective database design, data modeling, and visual representation of relationships between the entities on the ER diagrams designed with Chen notation.
 Crow's Foot Notation
Crow’s Foot Notation solution extends ConceptDraw DIAGRAM software with powerful drawing tools, samples and library of predesigned vector Crow's Foot notation icons to help you easy describe the databases using the Entity-Relationship models and design professional-looking ER diagrams based on the popular Crow's Foot notation.
Business Process Mapping — How to Map a Work Process

How To Draw an iPhone?

Data Flow Diagram Examples

 Active Directory Diagrams
Active Directory Diagrams solution significantly extends the capabilities of ConceptDraw DIAGRAM software with special Active Directory samples, convenient template and libraries of Active Directory vector stencils, common icons of sites and services, icons of LDPA elements, which were developed to help you in planning and modelling network structures and network topologies, in designing excellently looking Active Directory diagrams, Active Directory Structure diagrams, and Active Directory Services diagram, which are perfect way to visualize detailed structures of Microsoft Windows networks, Active Directory Domain topology, Active Directory Site topology, Organizational Units (OU), and Exchange Server organization.
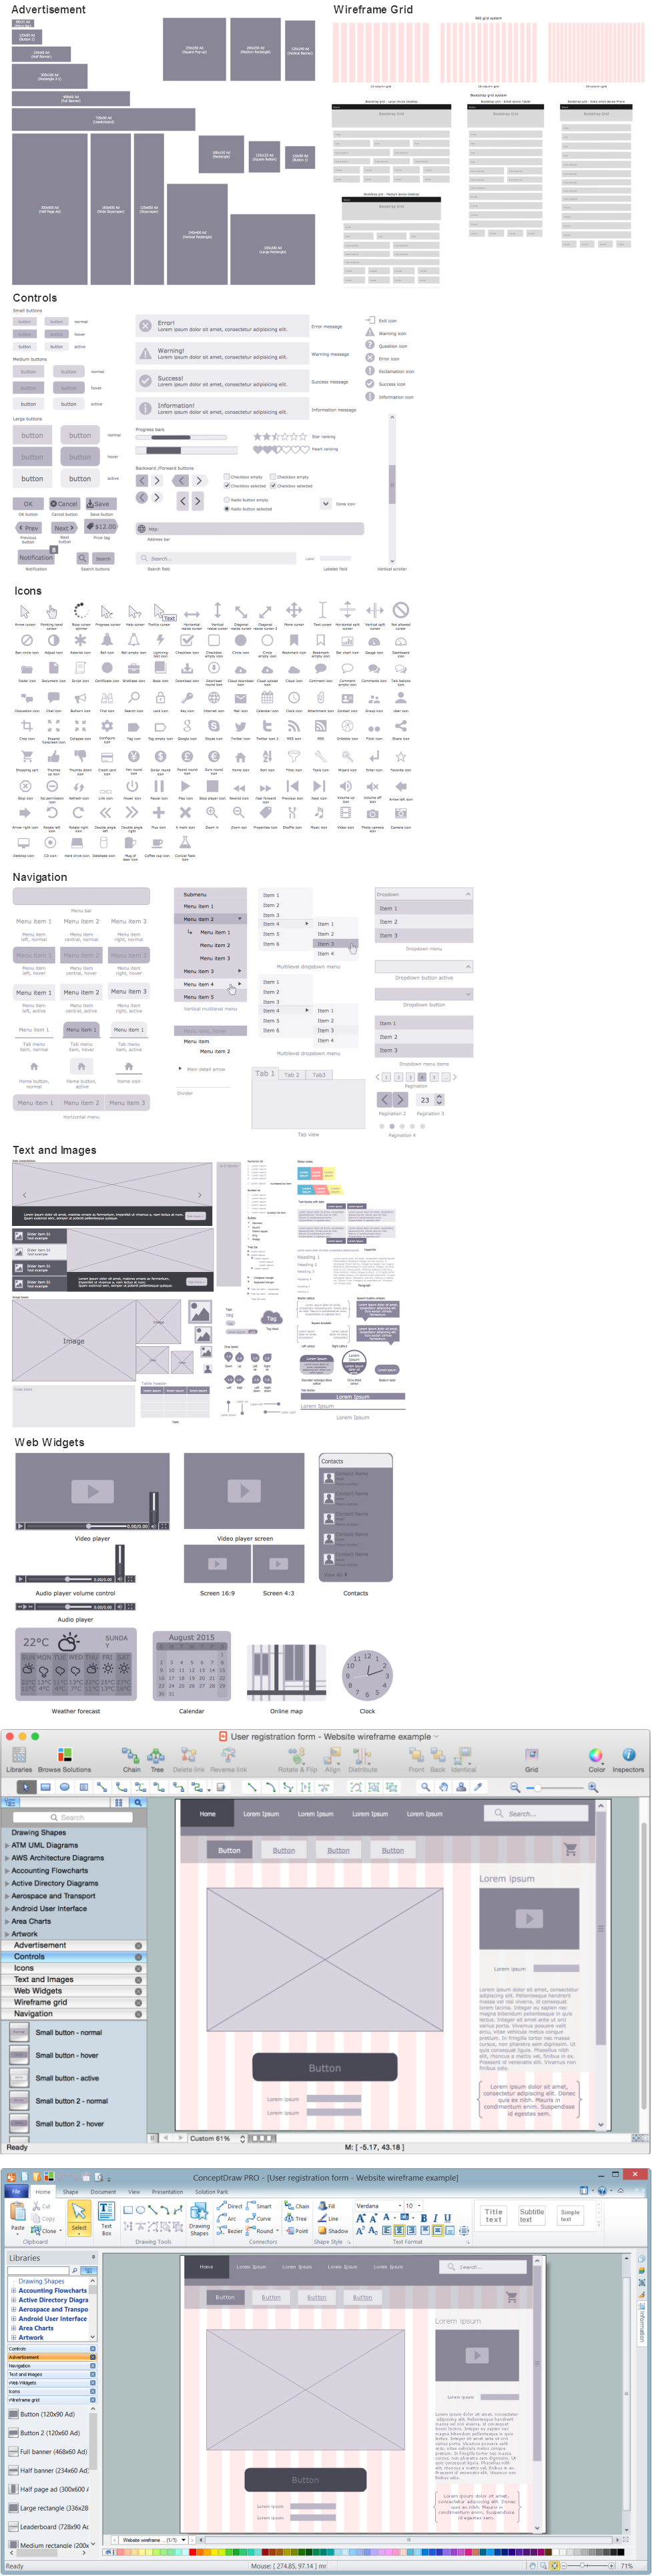
Wireframing
- Calendars | Entity-Relationship Diagram ( ERD ) | Entity-Relationship ...
- Er Diagram For Calendar Application
- Data Flow Diagram For Calendar Program
- Entity-Relationship Diagram ( ERD ) | Business Process Modeling ...
- Calendars | Spatial infographics Design Elements: Transport Map ...
- How to Create an Entity-Relationship Diagram Using ConceptDraw ...
- Computer Network Diagrams | Entity-Relationship Diagram ( ERD ...
- Er Diagram Tour And Travel Agency
- Process Flowchart | Chen Notation | Block Diagrams | Images For Er ...