Data Visualization Solutions

Performance Indicators

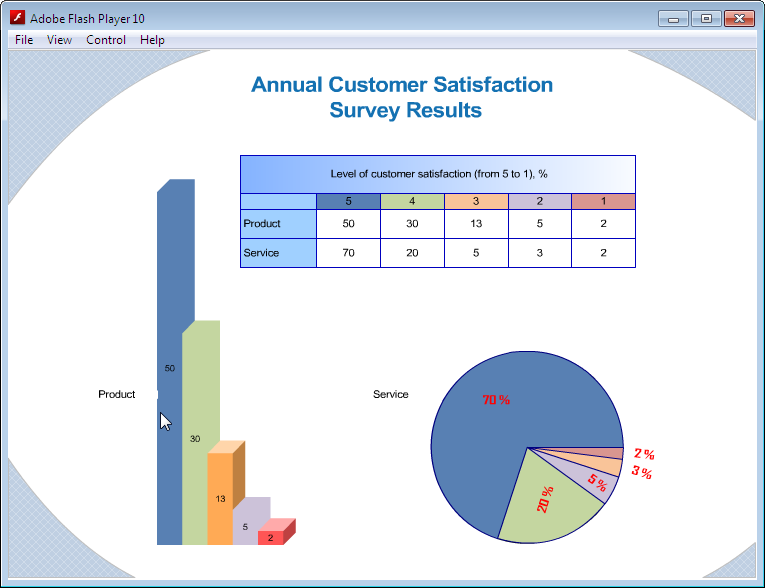
Export from ConceptDraw DIAGRAM Document to SWF (Adobe® Flash®) File

 Logistic Dashboard
The powerful tools of Logistic Dashboard solution and specially developed live graphic objects of logistic icons, logistic navigation elements, logistic indicators, logistic charts and logistic maps effectively assist in designing Logistic dashboards, Logistic maps, Logistic charts, diagrams and infographics. The included set of prebuilt samples and quick-start templates, demonstrates the power of ConceptDraw DIAGRAM software in logistics management, its assisting abilities in development, realization and analyzing the logistic processes, as well as in perfection the methods of logistics management.
 Sales Dashboard
Sales Dashboard solution extends ConceptDraw DIAGRAM software with templates, samples and library of vector stencils for drawing the visual dashboards of sale metrics and key performance indicators (KPI).
Software development with ConceptDraw DIAGRAM

HelpDesk
How to Create a Meter Dashboard

TQM Diagram Example

 PM Dashboards
The PM Dashboards solution extends the management boundaries of ConceptDraw DIAGRAM and ConceptDraw PROJECT products with an ability to demonstrate changes to the budget status, to show the project progress toward its objectives, to display clearly the identified key performance indicator (KPI) or the set of key performance indicators for any project. This solution provides you with examples and ability to generate three types of visual dashboards reports based on your project data Project Dashboard, Tactical Dashboard, and Radar Chart. By dynamically charting the project’s key performance indicators that are collected on one ConceptDraw DIAGRAM document page, all project participants, project managers, team members, team leaders, stakeholders, and the entire organizations, for which this solution is intended, have access to the daily status of projects they are involved in.
Comparing ConceptDraw DIAGRAM to Omnigraffle

 Status Dashboard
Status dashboard solution extends ConceptDraw DIAGRAM software with templates, samples and vector stencils libraries with graphic indicators for drawing the visual dashboards showing status data.
Export from ConceptDraw DIAGRAM Document to MS Visio® XML

HelpDesk
How to Create a Sales Dashboard

 Sales Dashboard
Sales Dashboard solution extends ConceptDraw DIAGRAM software with templates, samples and library of vector stencils for drawing the visual dashboards of sale metrics and key performance indicators (KPI).
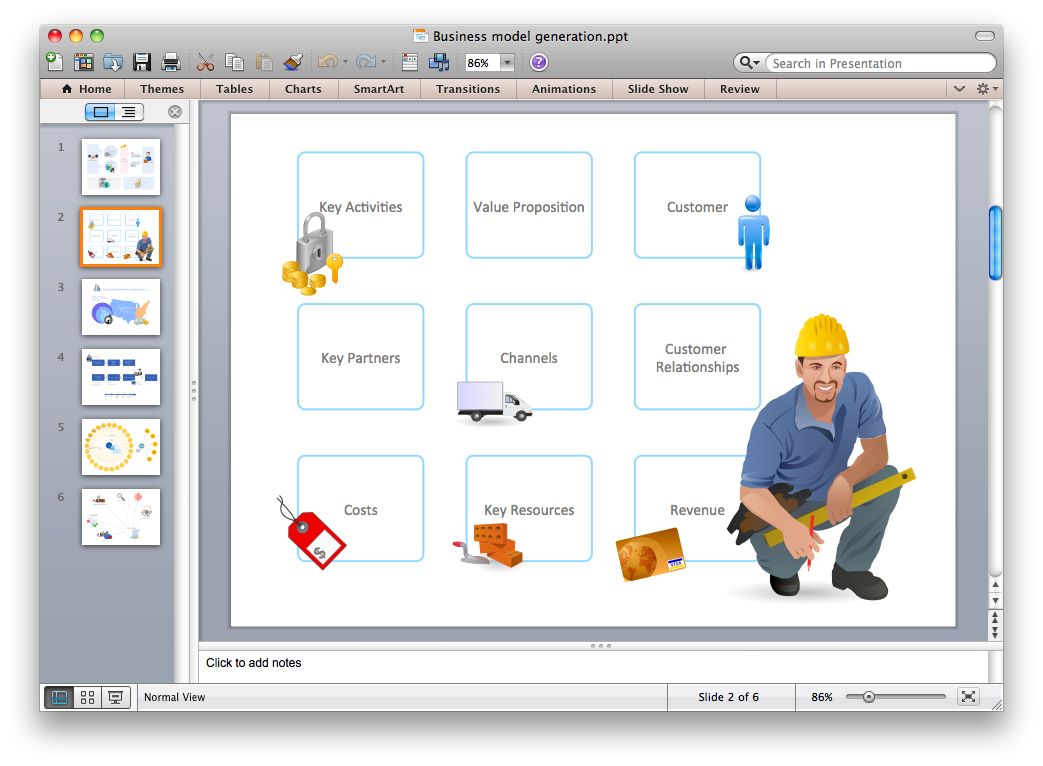
Export from ConceptDraw DIAGRAM Document to PPT or PPTX (MS PowerPoint®) File
- Engineering Kpi Dashboard
- KPI Dashboard | TQM Diagram Example | Business Graphics ...
- Sample Motors Sales Bi Dashboard Report
- Performance Indicators | The Facts and KPIs | KPIs and Metrics ...
- Mechanical Drawing Symbols | Cause and Effect Diagrams | KPI ...
- Simple Kpi Dashboard Template Excel
- Types of Welding in Flowchart | Technical Drawing Software ...
- Kpi Dashboard In World Map Samples
- Chemical and Process Engineering | Flowsheet Of Pie Chart
- Mechanical Drawing Symbols | Cloud clipart - Vector stencils library ...
- What is a KPI ? | KPI Dashboard | Sales Dashboard | Sample Kpis ...
- Employee Kpi Template Excel
- Sales KPIs and Metrics - Vector stencils library | Design elements ...
- Visual Indicators For Engineering Department
- Intelligent Transportation Systems Examples
- Swot Analysis Of Engineering Department
- Gauges Chart Example
- Sales KPI Dashboards | KPIs and Metrics | Reporting Dashboard ...
- Employee Kpi Dashboard
- Mechanical Engineering Bar Chart