"Subjective performance evaluation allows the use of a subtler, more balanced assessment of employee performance, and is typically used for more complex jobs where comprehensive objective measures are difficult to specify and/ or measure. Whilst often the only feasible method, the attendant problems with subjective performance evaluation have resulted in a variety of incentive structures and supervisory schemes. One problem, for example, is that supervisors may under-report performance in order to save on wages, if they are in some way residual claimants, or perhaps rewarded on the basis of cost savings. This tendency is of course to some extent offset by the danger of retaliation and/ or demotivation of the employee, if the supervisor is responsible for that employee’s output. ...
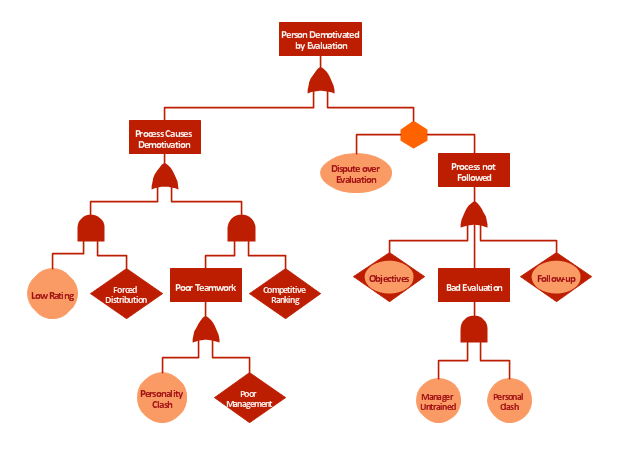
Another problem relates to what is known as the "compression of ratings". Two related influences—centrality bias, and leniency bias—have been documented ... The former results from supervisors being reluctant to distinguish critically between workers (perhaps for fear of destroying team spirit), while the latter derives from supervisors being averse to offering poor ratings to subordinates, especially where these ratings are used to determine pay, not least because bad evaluations may be demotivating rather than motivating. However, these biases introduce noise into the relationship between pay and effort, reducing the incentive effect of performance-related pay. ... this is the reason for the common separation of evaluations and pay, with evaluations primarily used to allocate training.
Finally, while the problem of compression of ratings originates on the supervisor-side, related effects occur when workers actively attempt to influence the appraisals supervisors give, either by influencing the performance information going to the supervisor: multitasking (focussing on the more visibly productive activities...), or by working “too hard” to signal worker quality or create a good impression...; or by influencing the evaluation of it, e.g., by "currying influence"... or by outright bribery..." [Principal–agent problem. Wikipedia]
The example "Person demotivated by evaluation - Fault tree analysis diagram" was created using the ConceptDraw PRO diagramming and vector drawing software extended with the Fault Tree Analysis Diagrams solution from the Engineering area of ConceptDraw Solution Park.
FTA diagram
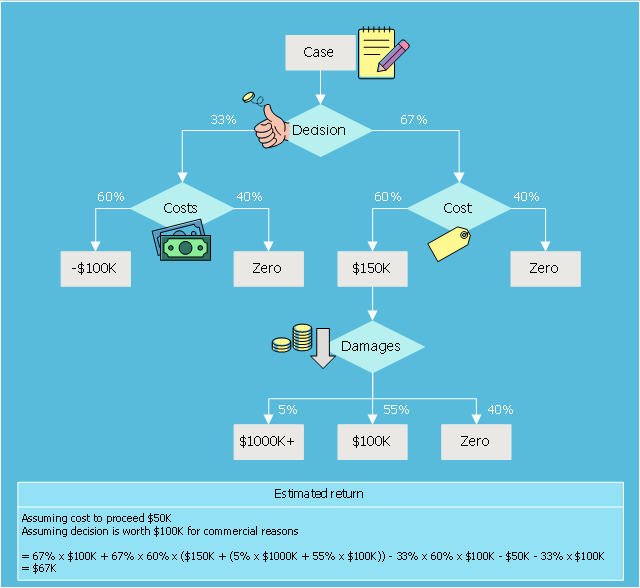
This example was designed on the base of Wikimedia Commons file: Decision tree using flow chart symbols.jpg.
"This is a decision tree that is written using flow chart symbols."
[commons.wikimedia.org/ wiki/ File:Decision_ tree_ using_ flow_ chart_ symbols.jpg]
This file is licensed under the Creative Commons Attribution-Share Alike 3.0 Unported license. [creativecommons.org/ licenses/ by-sa/ 3.0/ deed.en]
"A decision tree is a flowchart-like structure in which each internal node represents a "test" on an attribute (e.g. whether a coin flip comes up heads or tails), each branch represents the outcome of the test, and each leaf node represents a class label (decision taken after computing all attributes). The paths from root to leaf represent classification rules." [Decision tree. Wikipedia]
The diagram example "Decision tree flowchart" was designed using ConceptDraw software extended with Decision Making solution from Management area of ConceptDraw Solution Park.
Decision diagram example
Active Directory Diagram

Process Flowchart


 ATM UML Diagrams
The ATM UML Diagrams solution lets you create ATM solutions and UML examples. Use ConceptDraw DIAGRAM as a UML diagram creator to visualize a banking system.
 Cloud Computing Diagrams
The Cloud Computing Diagrams solution extends the functionality of the ConceptDraw DIAGRAM diagramming software with a comprehensive collection of libraries of commonly accepted cloud computing vector stencils to help you to get started designing Cloud Computing Diagrams, Architecture Diagrams and Cloud Computing Architecture Diagrams without effort. This solution lets one professionally depict the way how the cloud computing works, allows giving a powerful introduction to the Cloud computing architecture and Amazon cloud computing architecture, to display the essence of the cloud computing, the main characteristics and classification of the cloud services thanks to the wide variety of predesigned samples and examples.
Local area network (LAN). Computer and Network Examples
 diagram")

Garrett IA Diagrams with ConceptDraw DIAGRAM

Work Order Process Flowchart. Business Process Mapping Examples

- Fault Tree Analysis Example | Fault Tree Analysis Diagrams | How to ...
- FTA diagram - Hazard analysis | Accident analytic tree - FTA ...
- Fault Tree Analysis Diagrams | Fault Tree Analysis Example | Fault ...
- Root cause analysis tree diagram - Template | Fault Tree Diagram ...
- Root cause analysis tree diagram - Template | New Year card ...
- How to Create a Fault Tree Analysis Diagram (FTD) in ConceptDraw ...
- How to Create a Fault Tree Analysis Diagram (FTD) in ConceptDraw ...
- Fault Tree Analysis Diagrams | Fault Tree Analysis Software | How to ...
- Fault Tree Analysis Example | Fault Tree Analysis Diagrams | Fault ...
- Fault Tree Analysis Diagrams | How to Create a Fault Tree Analysis ...