HelpDesk
How to Create Education Infographics
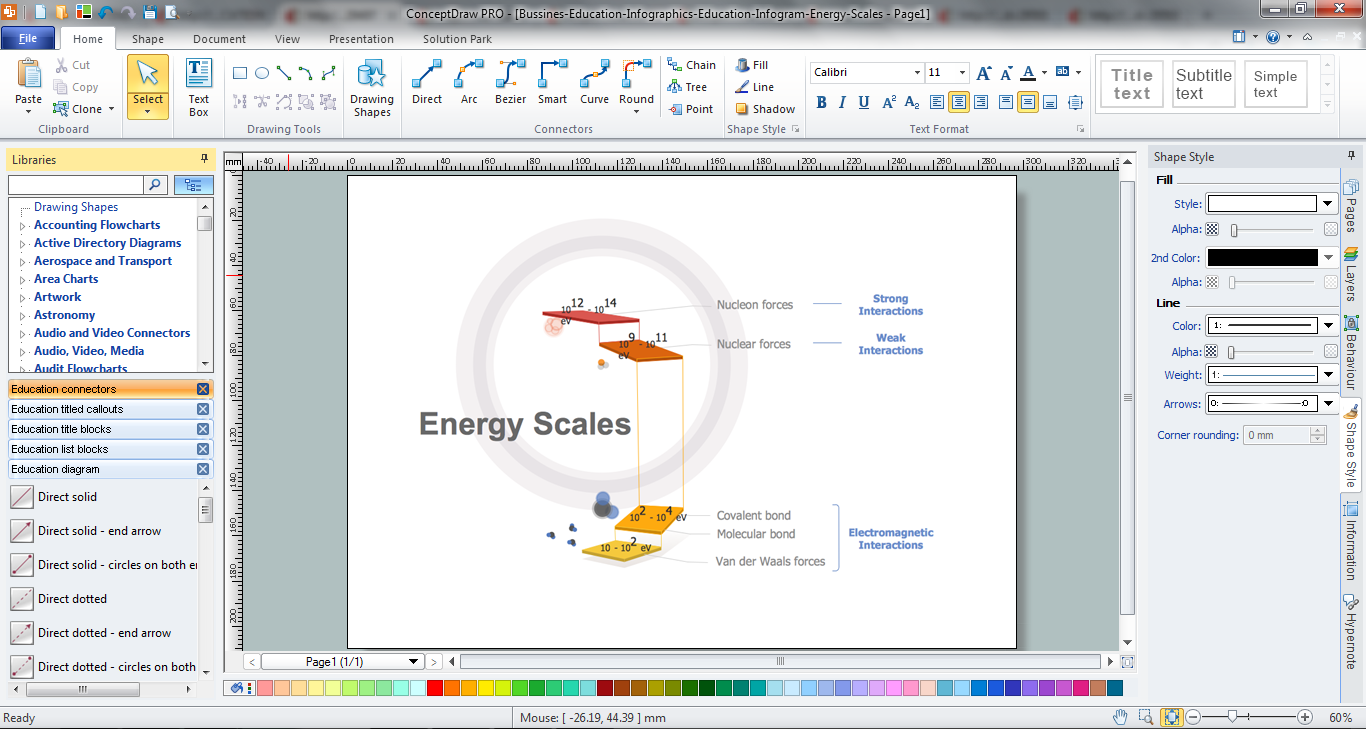
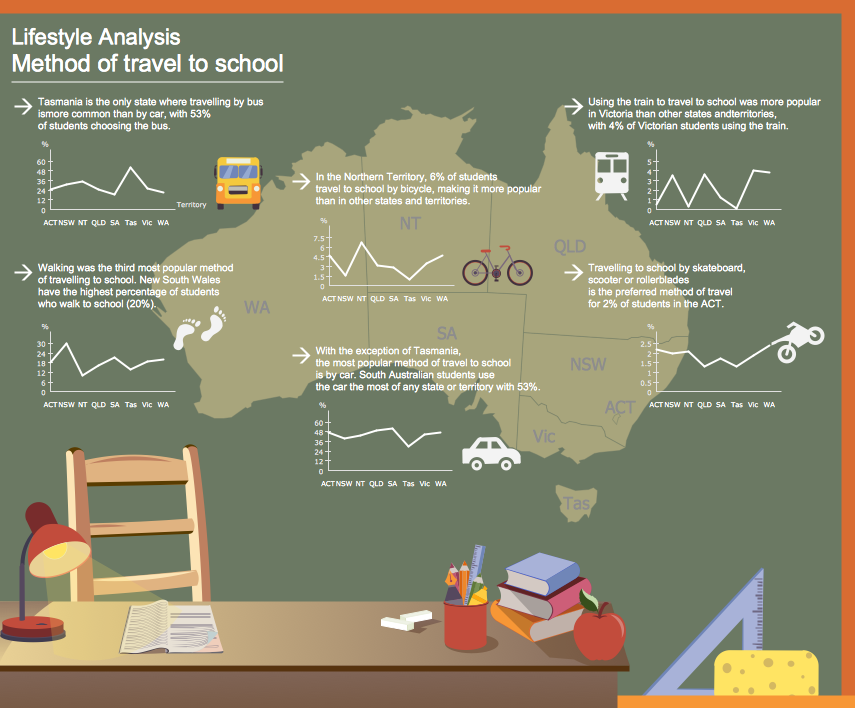
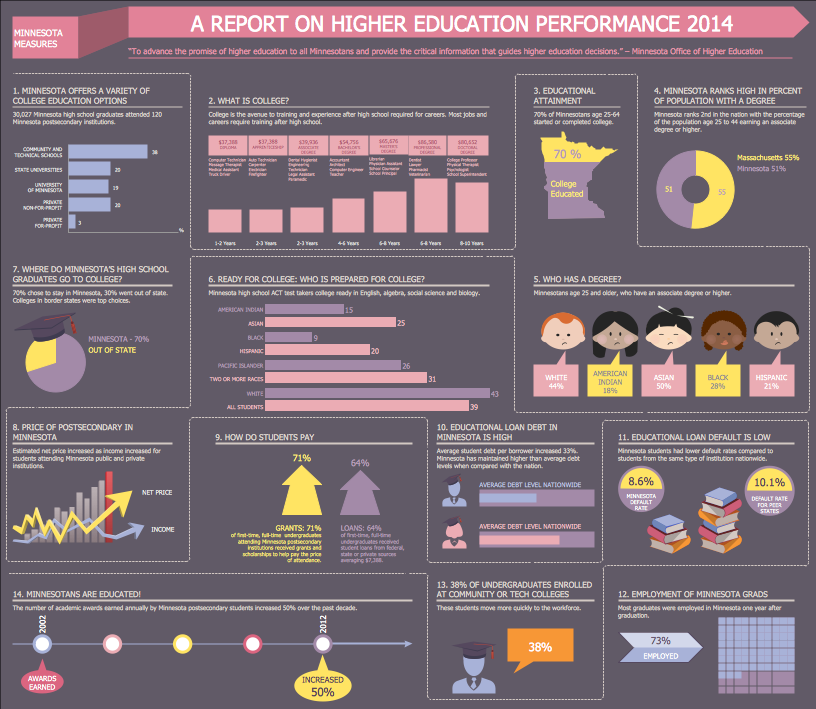
ConceptDraw PRO can be used as a tool for creating education infographics. It allows you to draw infographics quickly and easily using the special templates and vector stencils libraries. Infographics can be used to quickly communicate a message, to simplify the presentation of large amounts of data, to see data patterns and relationships, and to monitor changes in variables over time. It can contain bar graphs, pie charts, histograms, line charts, e.t.c.Education Infographics
The Education Infographics are popular and effectively applied in the educational process. Now you don't need to be an artist to design colorful pictorial education infographics thanks to the unique drawing tools of Education Infographics Solution for ConceptDraw PRO diagramming and vector drawing software.Make an Infographic
You want to make an infographic and need the useful and convenient drawing tools for this? In this case the ConceptDraw PRO software extended with Education Infographics Solution is a real godsend for you.How to Make an Infographic
How to Make an Infographic quick and easy? The perfect way is to use the ConceptDraw PRO diagramming and vector drawing software extended with Education Infographics Solution from the Business Infographics Area.Educational Technology Tools
What are the favorite educational technology tools and techniques for teachers? Of course these are pictures, images and education infographics! ConceptDraw PRO software supplied with Education Infographics Solution from the Business Infographics Area provides powerful drawing tools to help design the education infographics of any complexity.Educational Materials
It is impossible to imagine the education process without educational materials and auxiliary illustrations. And it is important that they will be bright, interesting and attractive for the pupils and students.ConceptDraw PRO diagramming and vector drawing software offers the Education Infographics Solution from the Business Infographics Area to help each education-related person create professional looking and attractive educational materials.
Education Information
The Education Information is multifariuos and can be often represented in various forms. Еру the most successful ways of presentation the information and data are various illustrations, diagrams and colorful education infographics which you can easily make in ConceptDraw PRO software extended with Education Infographics Solution from the Business Infographics Area.
 ConceptDraw Solution Park
ConceptDraw Solution Park collects graphic extensions, examples and learning materials
Information Graphic
Information graphic or infographic is a visual representation of various information, data or knowledge. ConceptDraw PRO extended with unique Education Infographics Solution from the Business Infographics Area will help you design any education information graphic without efforts.
 Spatial Infographics
Spatial infographics solution extends ConceptDraw PRO software with infographic samples, map templates and vector stencils libraries with design elements for drawing spatial information graphics.
HelpDesk
How to Make a Web Page from Infographics in ConceptDraw PRO
Create your own original marketing illustrations and infographics, presentation slides, website, and blog pages using ConceptDraw PRO.
 What are Infographic Area
Solutions of the area What is Infographics from ConceptDraw Solution Park collect templates, samples and vector stencils libraries with design elements for the drawing information graphics.
HelpDesk
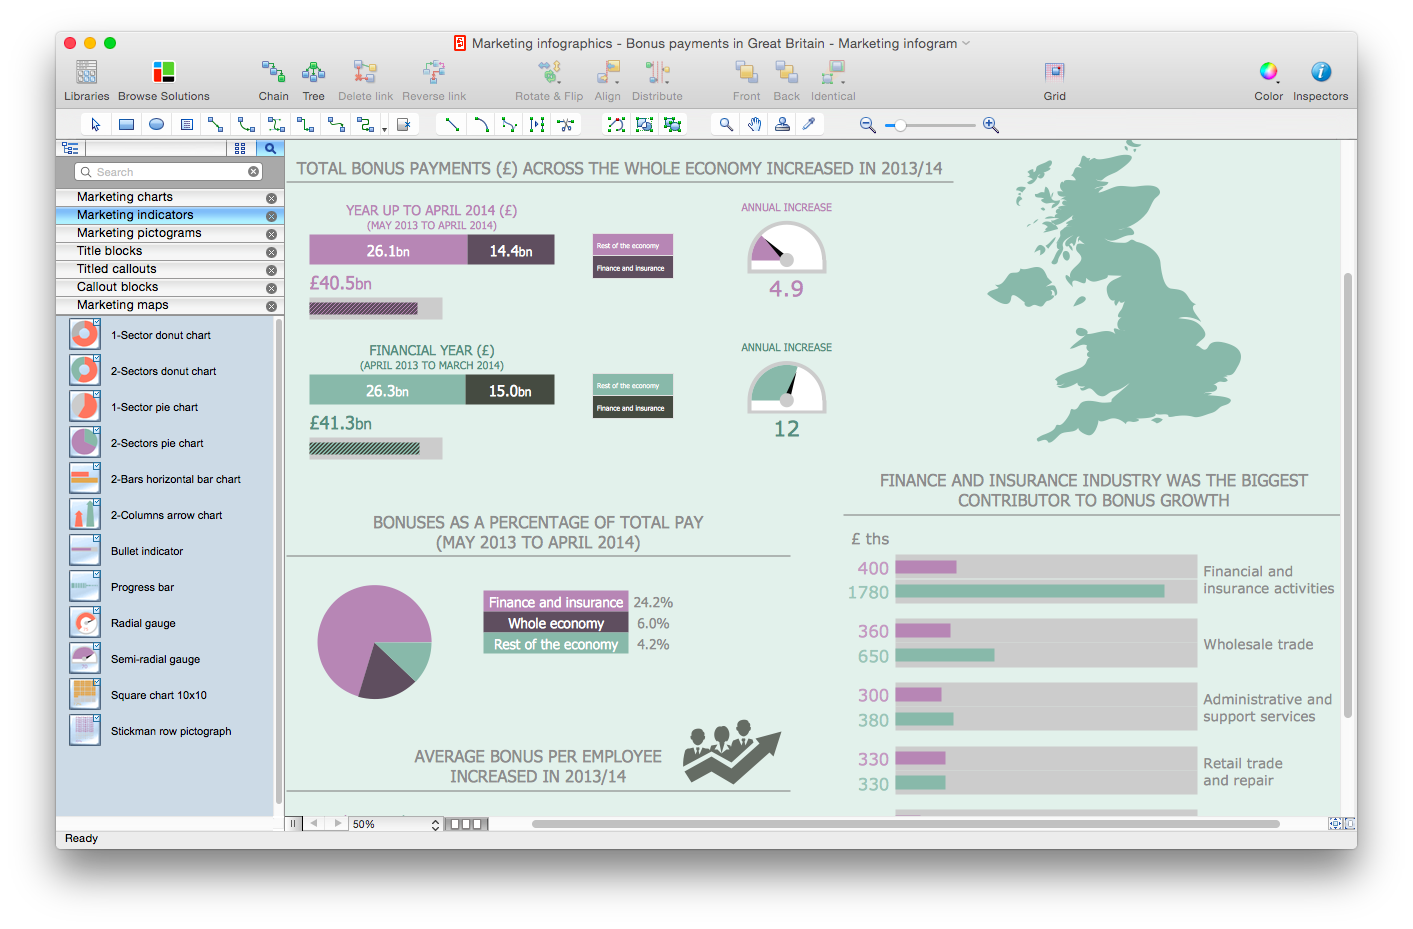
How to Create Marketing Infographics
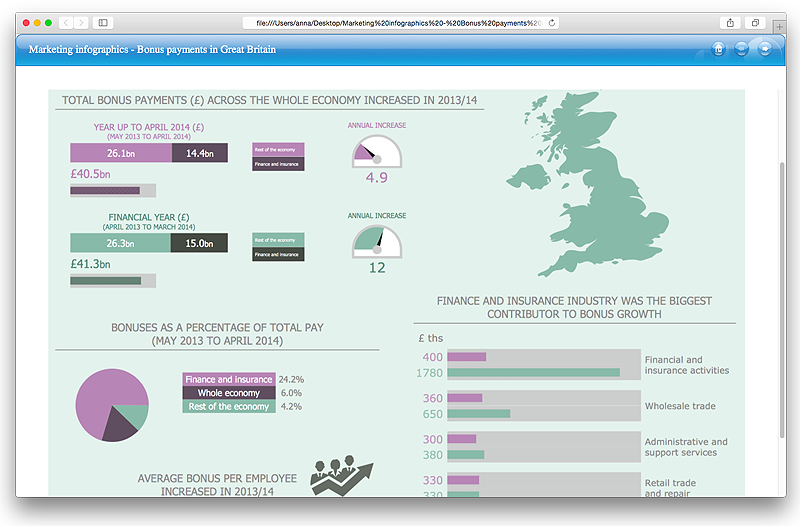
ConceptDraw PRO can be used as a tool for creating marketing infographics. It allows you to draw marketing infographics quickly and easily using the special templates and vector stencils libraries. Marketing Infographics can be used to quickly communicate a message, to simplify the presentation of large amounts of data, to see data patterns and relationships, and to monitor changes in variables over time. It can contain bar graphs, pie charts, histograms, line charts, e.t.c.- Concept maps with ConceptDraw PRO | Education | What is ...
- Presentations in Educational Process
- Map Infographic Creator | Best Tool for Infographic Construction ...
- How to Make an Infographic | How to Make a Web Page from ...
- Excellent Examples of Infographic Maps | Spatial Infographics | PM ...
- Conceptdraw.com: Mind Map Software, Drawing Tools | Project ...
- Illustration | Vector clipart - Gestures | Education | Clipart Actions
- Business Processes
- How to draw Metro Map style infographics ? Moscow, New York, Los ...
- Winter Sports | Winter Sports Vector Clipart. Medal Map. Spatial ...
- Education | Beauty in nature Illustrations and Clipart | Nature Clipart ...
- What is Infographics Area | Total Quality Management with ...
- Education | Business People Clipart | Marketing - Design Elements ...
- How to draw Metro Map style infographics ? (New York) | How to ...
- Maps | Map Infographic Creator | Brilliant Examples of Infographics ...
- Picture Graphs | Building Drawing Software for Design Sport Fields ...
- Aerospace - Design Elements | Aircraft - Design Elements | Rail ...
- Infographic design elements, software tools Subway and Metro style ...
- Safety and Security | What is Infographics Area | Fishbone Diagram ...
- What is Infographics Area | Wireless Networks | Data Flow Diagrams ...


