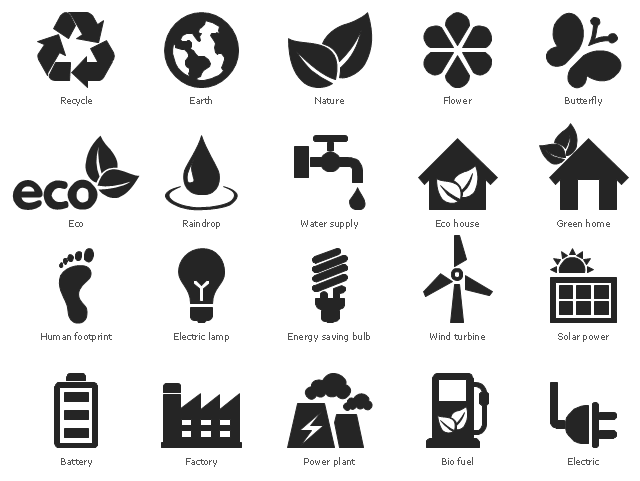
The vector stencils library "Ecology pictograms" contains 20 icons of eco symbols. Use it to draw your ecological infographics. The example "Ecology pictograms - Vector stencils library" was created using the ConceptDraw PRO diagramming and vector drawing software extended with the Pictorial infographics solution from the area "What is infographics" in ConceptDraw Solution Park.
Recycle

Nature

Flower

Butterfly

Earth

Raindrop

Water supply
Eco house

Green home

Electric

Electric lamp

Energy saving bulb

Factory

Power plant
Battery

Bio fuel
Wind turbine

Solar power

Eco
Human footprint

The vector stencils library "Ecology pictograms" contains 20 ecological pictograms.
Use it to draw your eco illustrations, presentations, web pages and infographics.
The example "Design elements - Ecology pictograms" was created using the ConceptDraw PRO diagramming and vector drawing software extended with the Pictorial Infographic solution from the area "What is infographics" in ConceptDraw Solution Park.
Eco pictograms
Energy Pyramid Diagram

Venn Diagram Examples for Problem Solving. Environmental Social Science. Human Sustainability Confluence

Geo Map of Americas

Beauty in nature Illustrations and Clipart

HelpDesk
How to Draw a Pictorial Chart in ConceptDraw PRO

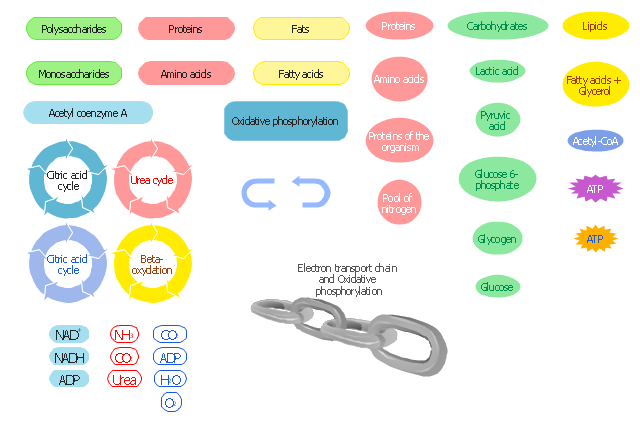
The vector stencils library " Biochemistry of metabolism" contains 46 metabolite symbols for drawing metabolic pathways maps, biochemical diagrams and metabolism process flow charts using the ConceptDraw PRO diagramming and vector drawing software.
"Metabolites are the intermediates and products of metabolism. The term metabolite is usually restricted to small molecules. Metabolites have various functions, including fuel, structure, signaling, stimulatory and inhibitory effects on enzymes, catalytic activity of their own (usually as a cofactor to an enzyme), defense, and interactions with other organisms (e.g. pigments, odorants, and pheromones). A primary metabolite is directly involved in normal "growth", development, and reproduction. Alcohol is an example of a primary metabolite produced in large-scale by industrial microbiology. A secondary metabolite is not directly involved in those processes, but usually has an important ecological function. Examples include antibiotics and pigments such as resins and terpenes etc. ...
The metabolome forms a large network of metabolic reactions, where outputs from one enzymatic chemical reaction are inputs to other chemical reactions." [Metabolite. Wikipedia]
The shapes example "Design elements - Biochemistry of metabolism" is included in the Biology solution from the Science and Education area of ConceptDraw Solution Park.
Metabolic pathway symbols
Flow Chart Creator

HR Flowchart Symbols

Simple Drawing Applications for Mac

How To Create a Bubble Chart

Venn Diagrams

- Ecology pictograms - Vector stencils library | How to Draw Pictorial ...
- Ecology pictograms - Vector stencils library | Ecology pictograms ...
- Ecology pictograms - Vector stencils library | Ecology pictograms ...
- Ecology pictograms - Vector stencils library
- Ecology pictograms - Vector stencils library | Ecology pictograms ...
- Entertainment - Vector stencils library | Ecology pictograms - Vector ...
- Ecology pictograms - Vector stencils library | Design elements ...
- Types of Flowcharts | Ecology pictograms - Vector stencils library ...
- Ecology pictograms - Vector stencils library | Design elements ...
- Ecology pictograms - Vector stencils library | Eco Picto
- Ecology pictograms - Vector stencils library | Types of Flowcharts ...
- Ecology pictograms - Vector stencils library | Ecology pictograms ...
- Design elements - Valves | Ecology pictograms - Vector stencils ...
- Ecology pictograms - Vector stencils library | Ecology pictograms ...
- Design elements - Ecology pictograms | Design elements - Ecology ...
- Ecology pictograms - Vector stencils library | Factory Picto
- Ecology pictograms - Vector stencils library | Tap Vectore
- Energy Pyramid Diagram | Ecology pictograms - Vector stencils ...
- Ecology pictograms - Vector stencils library | Rain Eco Pictogram
- Ecology pictograms - Vector stencils library | Electricity Picto