This is a schematic process flow diagram of the processes used in a typical oil refinery.
This process flow diagram (PFD) example was redesigned from the Wikimedia Commons file: RefineryFlow.png. [commons.wikimedia.org/ wiki/ File:RefineryFlow.png]
This file is licensed under the Creative Commons Attribution-Share Alike 3.0 Unported license. [creativecommons.org/ licenses/ by-sa/ 3.0/ deed.en]
"An oil refinery or petroleum refinery is an industrial process plant where crude oil is processed and refined into more useful products such as petroleum naphtha, gasoline, diesel fuel, asphalt base, heating oil, kerosene and liquefied petroleum gas. Oil refineries are typically large, sprawling industrial complexes with extensive piping running throughout, carrying streams of fluids between large chemical processing units. In many ways, oil refineries use much of the technology of, and can be thought of, as types of chemical plants. The crude oil feedstock has typically been processed by an oil production plant. There is usually an oil depot (tank farm) at or near an oil refinery for the storage of incoming crude oil feedstock as well as bulk liquid products.
An oil refinery is considered an essential part of the downstream side of the petroleum industry." [Oil refinery. Wikipedia]
The PFD example "Process flow diagram - Typical oil refinery" was created using the ConceptDraw PRO diagramming and vector drawing software extended with the Chemical and Process Engineering solution from the Chemical and Process Engineering area of ConceptDraw Solution Park.
Process Flow Diagram (PFD)
-process-flow-diagram---typical-oil-refinery.png--diagram-flowchart-example.png)
This divided bar chart sample shows the petroleum products yielded from 1 barrel of crude oil in California in 2004. It was drawn using data from the chart on the California Energy Almanac website. [energyalmanac.ca.gov/ gasoline/ whats_ in_ barrel_ oil.html]
"Petroleum products are useful materials derived from crude oil (petroleum) as it is processed in oil refineries. Unlike petrochemicals, which are a collection of well-defined usually pure chemical compounds, petroleum products are complex mixtures. The majority of petroleum is converted to petroleum products, which includes several classes of fuels.
According to the composition of the crude oil and depending on the demands of the market, refineries can produce different shares of petroleum products. The largest share of oil products is used as "energy carriers", i.e. various grades of fuel oil and gasoline. These fuels include or can be blended to give gasoline, jet fuel, diesel fuel, heating oil, and heavier fuel oils. Heavier (less volatile) fractions can also be used to produce asphalt, tar, paraffin wax, lubricating and other heavy oils. Refineries also produce other chemicals, some of which are used in chemical processes to produce plastics and other useful materials. Since petroleum often contains a few percent sulfur-containing molecules, elemental sulfur is also often produced as a petroleum product. Carbon, in the form of petroleum coke, and hydrogen may also be produced as petroleum products. The hydrogen produced is often used as an intermediate product for other oil refinery processes such as hydrocracking and hydrodesulfurization." [Petroleum product. Wikipedia]
The chart example "Petroleum products yielded from one barrel of crude oil" was created using the ConceptDraw PRO diagramming and vector drawing software extended with the Divided Bar Diagrams solution from the Graphs and Charts area of ConceptDraw Solution Park.
Divided bar chart

The vector stencils library "Resources and energy" contains 19 clipart images for drawing illustrations on resources and energy.
"Natural resources occur naturally within environments that exist relatively undisturbed by humanity, in a natural form. A natural resource is often characterized by amounts of biodiversity and geodiversity existent in various ecosystems.
Natural resources are derived from the environment. Some of them are essential for our survival while most are used for satisfying our wants. Natural resources may be further classified in different ways.
Natural resources are materials and components (something that can be used) that can be found within the environment. Every man-made product is composed of natural resources (at its fundamental level). A natural resource may exist as a separate entity such as fresh water, and air, as well as a living organism such as a fish, or it may exist in an alternate form which must be processed to obtain the resource such as metal ores, oil, and most forms of energy." [Natural resource. Wikipedia]
The clip art example "Resources and energy - Vector stencils library" was created in ConceptDraw PRO diagramming and vector drawing software using the Manufacturing and Maintenance solution from the Illustration area of ConceptDraw Solution Park.
Human resources

Batteries

Wind turbine

Transmission tower

Natural gas burner

Solar panel

Lightning

Ionizing radiation hazard sign

High voltage symbol

Atom

Incandescent light bulb

Oil barrels

Power station

Wood

Perpetuum mobile

Hydroelectric dam

Liquefied petroleum gas

Natural gas

Minecart with coal

This process flow diagram (PFD) of a typical crude oil distillation unit as used in petroleum crude oil refineries was redrawn from Wikipedia file: Crude Oil Distillation Unit.png. [en.wikipedia.org/ wiki/ File:Crude_ Oil_ Distillation_ Unit.png]
This file is licensed under the Creative Commons Attribution-Share Alike 3.0 Unported license. [creativecommons.org/ licenses/ by-sa/ 3.0/ deed.en]
"An oil refinery or petroleum refinery is an industrial process plant where crude oil is processed and refined into more useful products such as petroleum naphtha, gasoline, diesel fuel, asphalt base, heating oil, kerosene and liquefied petroleum gas. Oil refineries are typically large, sprawling industrial complexes with extensive piping running throughout, carrying streams of fluids between large chemical processing units. In many ways, oil refineries use much of the technology of, and can be thought of, as types of chemical plants. The crude oil feedstock has typically been processed by an oil production plant. There is usually an oil depot (tank farm) at or near an oil refinery for the storage of incoming crude oil feedstock as well as bulk liquid products.
An oil refinery is considered an essential part of the midstream side of the petroleum industry." [en.wikipedia.org/ wiki/ Oil_ refinery]
The process flow diagram (PFD) example "Crude oil distillation" was drawn using the ConceptDraw PRO diagramming and vector drawing software extended with the Chemical and Process Engineering solution from the Chemical and Process Engineering area of ConceptDraw Solution Park.
Process flow diagram (PFD)
-crude-oil-distillation-unit---pfd.png--diagram-flowchart-example.png)
Process Flow Diagram Symbols

Geo Map - Europe - Norway

Geo Map - USA - Illinois

Process Flow Diagram

This process flow diagram (PFD) example shows an amine treating system for the removal of gaseous hydrogen sulfide from gas streams. It is used in oil refineries and chemical plants. This PFD sample was redesigned from the Wikimedia Commons file: AmineTreating.png. [commons.wikimedia.org/ wiki/ File:AmineTreating.png]
This file is licensed under the Creative Commons Attribution-Share Alike 3.0 Unported license. [creativecommons.org/ licenses/ by-sa/ 3.0/ deed.en]
"Amine gas treating, also known as gas sweetening and acid gas removal, refers to a group of processes that use aqueous solutions of various alkylamines (commonly referred to simply as amines) to remove hydrogen sulfide (H2S) and carbon dioxide (CO2) from gases. It is a common unit process used in refineries, and is also used in petrochemical plants, natural gas processing plants and other industries.
Processes within oil refineries or chemical processing plants that remove hydrogen sulfide are referred to as "sweetening" processes because the odor of the processed products is improved by the absence of hydrogen sulfide. An alternative to the use of amines involves membrane technology. Membranes are attractive since no reagents are consumed.
Many different amines are used in gas treating:
Diethanolamine (DEA),
Monoethanolamine (MEA),
Methyldiethanolamine (MDEA),
Diisopropanolamine (DIPA),
Aminoethoxyethanol (Diglycolamine) (DGA).
The most commonly used amines in industrial plants are the alkanolamines DEA, MEA, and MDEA. These amines are also used in many oil refineries to remove sour gases from liquid hydrocarbons such as liquified petroleum gas (LPG)." [Amine gas treating. Wikipedia]
The PFD example "Amine treating unit schematic diagram" was drawn using the ConceptDraw PRO diagramming and vector drawing software extended with the Chemical and Process Engineering solution from the Chemical and Process Engineering area of ConceptDraw Solution Park.
Process Flow Diagram (PFD)
-amine-treating-unit-schematic-diagram.png--diagram-flowchart-example.png)
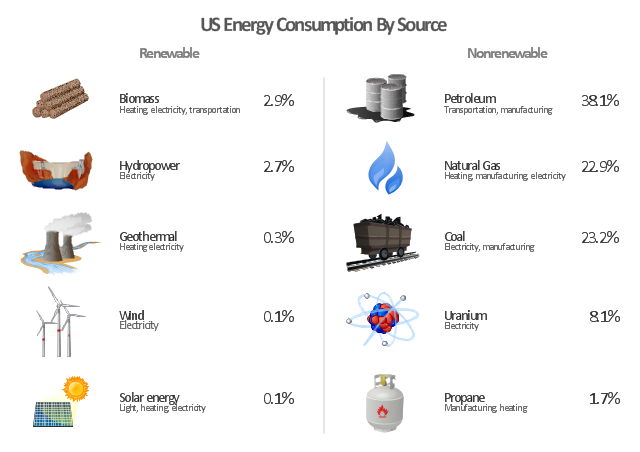
"The United States is the 800th largest energy consumer in terms of total use in 2010. ...
The majority of this energy is derived from fossil fuels: in 2010, data showed 25% of the nation's energy came from petroleum, 22% from coal, and 22% from natural gas. Nuclear power supplied 8.4% and renewable energy supplied 8%, which was mainly from hydroelectric dams although other renewables are included such as wind power, geothermal and solar energy." [Energy in the United States. Wikipedia]
The infographics example "U.S. energy consumption by source" was created in the ConceptDraw PRO diagramming and vector drawing software using the Manufacturing and Maintenance solution from the Illustration area of ConceptDraw Solution Park.
Infographics
CAD Software for Architectural Designs

Use the libraries with a set of vector objects, templates and samples from the Floor Plans Solution from the Building Plans area of ConceptDraw Solution Park for designing your professional architectural designs.
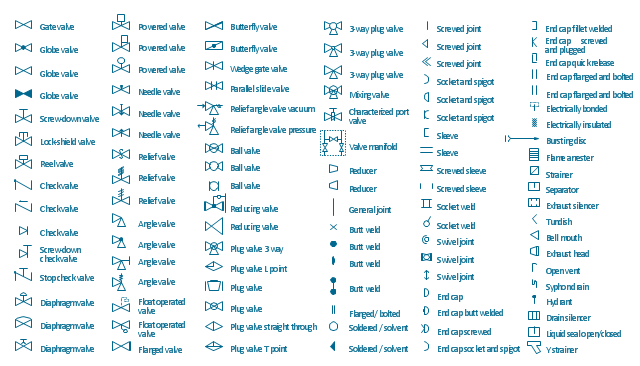
The vector stencils library "Valves and fittings" contains 104 symbols of valve components.
Use these icons for drawing industrial piping systems; process, vacuum, and fluids piping; hydraulics piping; air and gas piping; materials distribution; and liquid transfer systems.
"A valve is a device that regulates, directs or controls the flow of a fluid (gases, liquids, fluidized solids, or slurries) by opening, closing, or partially obstructing various passageways. Valves are technically valves fittings, but are usually discussed as a separate category. In an open valve, fluid flows in a direction from higher pressure to lower pressure.
The simplest, and very ancient, valve is simply a freely hinged flap which drops to obstruct fluid (gas or liquid) flow in one direction, but is pushed open by flow in the opposite direction. This is called a check valve, as it prevents or "checks" the flow in one direction. ...
Valves are found in virtually every industrial process, including water & sewage processing, mining, power generation, processing of oil, gas & petroleum, food manufacturing, chemical & plastic manufacturing and many other fields. ...
Valves may be operated manually, either by a handle, lever, pedal or wheel. Valves may also be automatic, driven by changes in pressure, temperature, or flow. These changes may act upon a diaphragm or a piston which in turn activates the valve, examples of this type of valve found commonly are safety valves fitted to hot water systems or boilers.
More complex control systems using valves requiring automatic control based on an external input (i.e., regulating flow through a pipe to a changing set point) require an actuator. An actuator will stroke the valve depending on its input and set-up, allowing the valve to be positioned accurately, and allowing control over a variety of requirements." [Valve. Wikipedia]
The example "Design elements - Valves and fittings" was created using the ConceptDraw PRO diagramming and vector drawing software extended with the Chemical and Process Engineering solution from the Engineering area of ConceptDraw Solution Park.
Valves and fittings symbols
Example Basic Flowchart. Flowchart Examples

Process Flow Chart

Quality Criteria MindMap

- Drawing Symbols On Petroleum Products
- Petroleum Conservation Resource Drawing
- Drawing Of Petroleum Plant
- Draw Petroleum Products
- Coal And Petroleum Drawing
- Basic Refinery Drawing
- Chemical and Process Engineering | Building Drawing Software for ...
- Oil Refinery Plant Drawing
- Discuss And Draw The Chart Of Petroleum
- Concumption Of Petroleum Drawing
- Petroleum Engineering Tools And Equipments
- Petroleum products yielded from one barrel of crude oil | Resources ...
- Petroleum Products Drawings
- Process flow diagram - Typical oil refinery | Process Flowchart ...
- Process Flow Diagram | Technical Drawing Software | Resources ...
- Chemical and Process Engineering | On Site Emergency Plan ...
- Picture Graphs | Petroleum products yielded from one barrel of ...
- A Drawing Of Composition Of Market
- Petrolum Refanary Plant Drawing
- Petroleum Pump Drawing