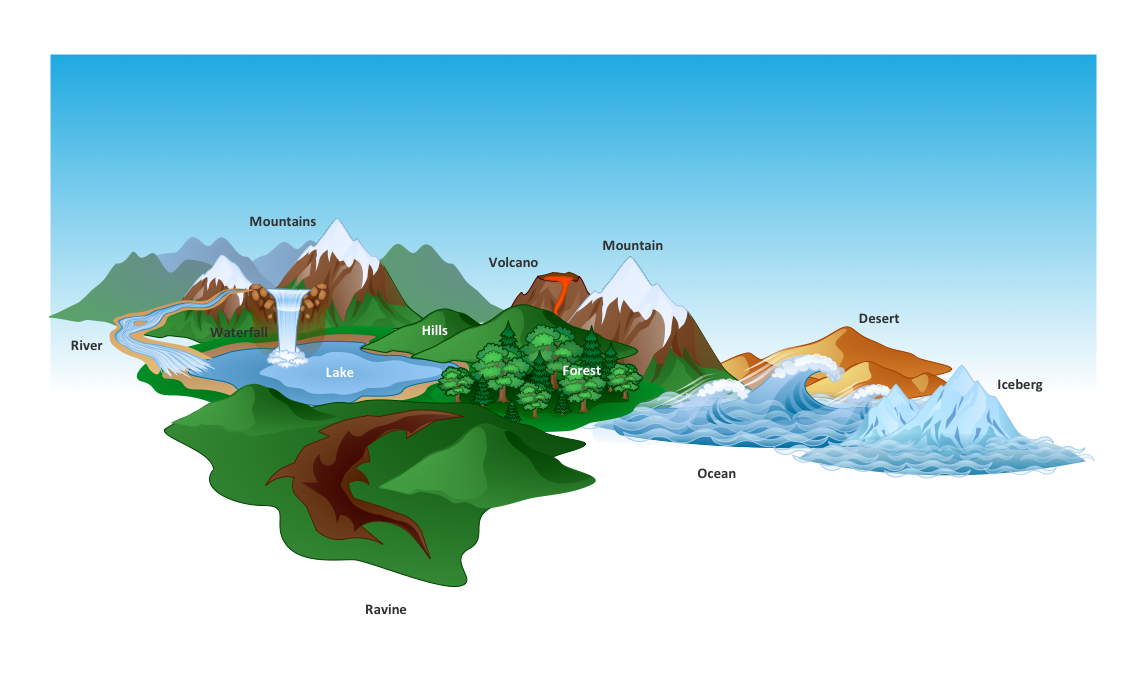
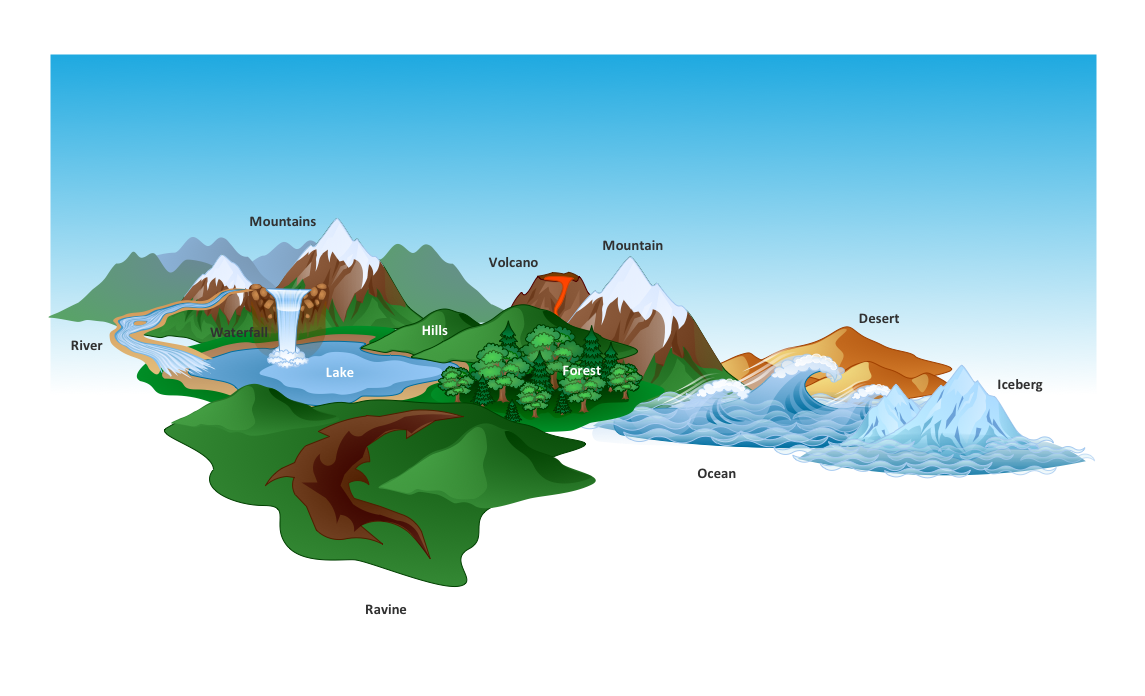
Beautiful Nature Scene: Drawing
The Nature Solution addition to ConceptDraw Solution Park for ConceptDraw PRO includes new libraries that provide a wide range nature objects and it can be used to augment documentation and graphics. Draw beautiful nature scenes using ConceptDraw PRO software with Nature solution.Drawing Illustration
The Nature Solution addition to ConceptDraw Solution Park for ConceptDraw PRO includes new libraries that provide a wide range nature objects and it can be used in many areas.Basic Diagramming
Perfect charts and graphics diagramming software with rich examples and template. ConceptDraw is ideal to draw Charts and Graphics.
How to Draw a Natural Landscape
Nature solution expands ConceptDraw PRO software with samples, templates and libraries of vector clip art for drawing of Nature illustrations. Use Geography library of vector stencils to draw natural landscapes.Chore charts with ConceptDraw PRO
Chore chart. Draw perfect-looking chore chart. Free chore chart samples. All about chore charts.Column Chart Software
ConceptDraw Column Chart software allows drawing column charts using predesigned objects or drawing tools. In ConceptDraw Column Chart software you can find a complete set of column chart tools and objects.Pie Chart Word Template. Pie Chart Examples
The Pie Chart visualizes the data as the proportional parts of a whole and looks like a disk divided into sectors. The pie chart is type of graph, pie chart looks as circle devided into sectors. Pie Charts are widely used in the business, statistics, analytics, mass media. It’s very effective way of displaying relative sizes of parts, the proportion of the whole thing.Four Dimensions Bubble Plot
This sample was created in ConceptDraw PRO diagramming and vector drawing software using the Bubble Diagrams Solution from the "Diagrams" area of ConceptDraw Solution Park. This sample clearly shows the Four Dimensions Bubble Diagram of the distribution of chlorine contaminant in the water source. This Bubble Diagram is very useful in the chemistry, hydrology, and ecology.Draw Flowcharts with ConceptDraw
Start design your own flowchart with ConceptDraw PRO and accomplish great results at the moment.Program to Make Flow Chart
Use ConceptDraw PRO diagramming and business graphics software for drawing your own PM life cycle flow charts.Cross-Functional Flowchart
Use of Cross-Functional Flowchart is a clear way of showing each team member’s responsibilities and how processes get shared or transferred between different responsible people, teams and departments. Use the best flowchart maker ConceptDraw PRO with a range of standardized cross-functional flowchart symbols to create the Cross-Functional Flowcharts simply and to visualize the relationship between a business process and the functional units responsible for that process. To draw the most quickly Cross-Functional Flowcharts, Cross Functional Process Maps, or Cross Functional Process Flow Diagrams, start with a Cross-functional flowchart samples and templates from ConceptDraw Solution Park. The ConceptDraw Arrows10 and RapidDraw technologies will be also useful for you in drawing. ConceptDraw PRO supports designing both types - horizontal and vertical Cross-functional flowcharts. A vertical layout makes the accents mainly on the functional units while a horizontal layout - on the process. If you need a Visio alternative in Mac OS X, try ConceptDraw PRO. Its interface is very intuitive and it’s actually much easier to use than Visio, yet somehow it’s just as powerful if not more so. ConceptDraw PRO performs professional quality work and seamless Visio interaction.
Chemistry Drawings
ConceptDraw PRO diagramming and vector drawing software extended with Chemistry solution from the Science and Education area is a powerful chemistry drawing software that is ideal for quick and easy designing of various: chemistry drawings, scientific and educational chemistry illustrations, schemes and diagrams of chemical and biological lab set-ups, images with chemical formulas, molecular structures, chemical reaction schemes, schemes of labware, that can be then successfully used in the field of science and education, on various conferences, and so on.How to Create a Cross Functional Flow Chart
If neither of 45 vector shapes of the Cross-Functional Flowcharts solution don't fit your needs, you will want to learn How to create a unique Cross-Functional flowchart. ConceptDraw Arrows10 Technology - This is more than enough versatility to draw any type of diagram with any degree of complexity. Drawing software lets you to make horizontal and vertical, audit, opportunity and many more flowcharts.Process Flow Chart
A Process Flow Chart is a type of flowchart which is mostly used in industrial, chemical and process engineering for illustrating high-level processes, major plant processes and not shows minor details. ConceptDraw PRO diagramming and vector drawing software extended with Flowcharts Solution from the "Diagrams" Area of ConceptDraw Solution Park is the best way to create Process Flow Chart and other types of flowcharts.Beauty of Event-driven Process Chain (EPC) diagrams
Event-Driven Process Chain Diagrams for improvement throughout an organisation. ConceptDraw PRO - software that reduces the time needed to create a business process model.- Drawing Illustration | How to Draw a Natural Landscape | Scientific ...
- Water cycle diagram | Drawing a Nature Scene | Nature | Digram ...
- Drawing a Nature Scene | Nature | Vehicular Networking | Flow ...
- Drawing Chart Of Nature
- Beautiful Nature Scene: Drawing | Drawing Illustration | Chore ...
- Drawing Illustration | Beautiful Nature Scene: Drawing | Drawing a ...
- Map Software | How to Draw a Natural Landscape | Nature ...
- Drawing Illustration | How to Draw a Natural Landscape | Drawing ...
- Beauty in nature Illustrations and Clipart | Biology Drawing Software ...
- Water cycle diagram | Drawing a Nature Scene | Drawing Illustration ...
- Drawing a Nature Scene | Beauty in nature Illustrations and Clipart ...
- Drawing Illustration | Nature | Artwork | Water Animals Chart For ...
- Beautiful Nature Scene: Drawing
- Drawing Illustration | Beauty in nature Illustrations and Clipart ...
- Drawing Illustration | Beautiful Nature Scene: Drawing | Basic ...
- Drawing a Nature Scene | Piping and Instrumentation Diagram ...
- Drawing Illustration | Nature | Program to Make Flow Chart | How ...
- Drawing a Nature Scene | Drawing Illustration | Beautiful Nature ...
- Basic Diagramming | Beautiful Nature Scene: Drawing | Chart ...
- Beautiful Nature Scene: Drawing | Cross-Functional Flowcharts | Pie ...


