Best Diagramming


Basic Flowchart Symbols and Meaning


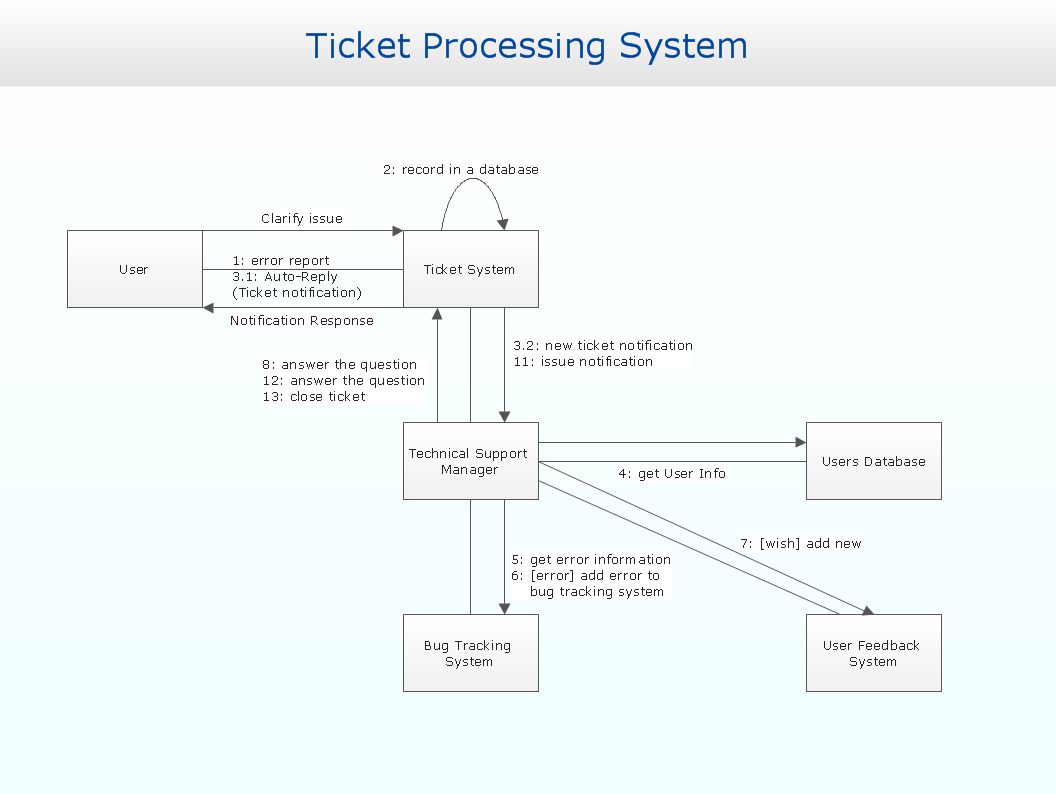
Communication Diagram UML2.0 / Collaboration UML1.x

Technical Flow Chart

Diagramming Software for Design UML Communication Diagrams

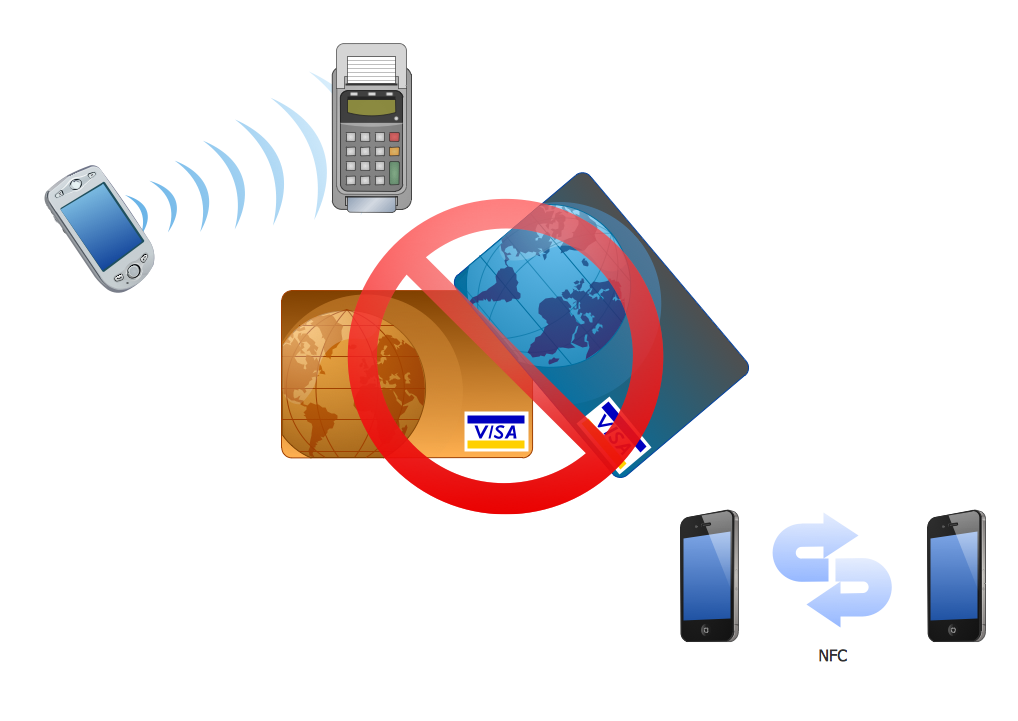
Near field communication (NFC). Computer and Network Examples

 Basic Circle-Spoke Diagrams
Basic circle-spoke diagrams are well suited for marketing, management documents, and presentations.
 Computers and Communications
Computers and communications solution extends ConceptDraw DIAGRAM software with illustration samples, templates and vector stencils libraries with clip art of computers, control devices, communications, technology, Apple machines.
Network Diagramming with ConceptDraw DIAGRAM
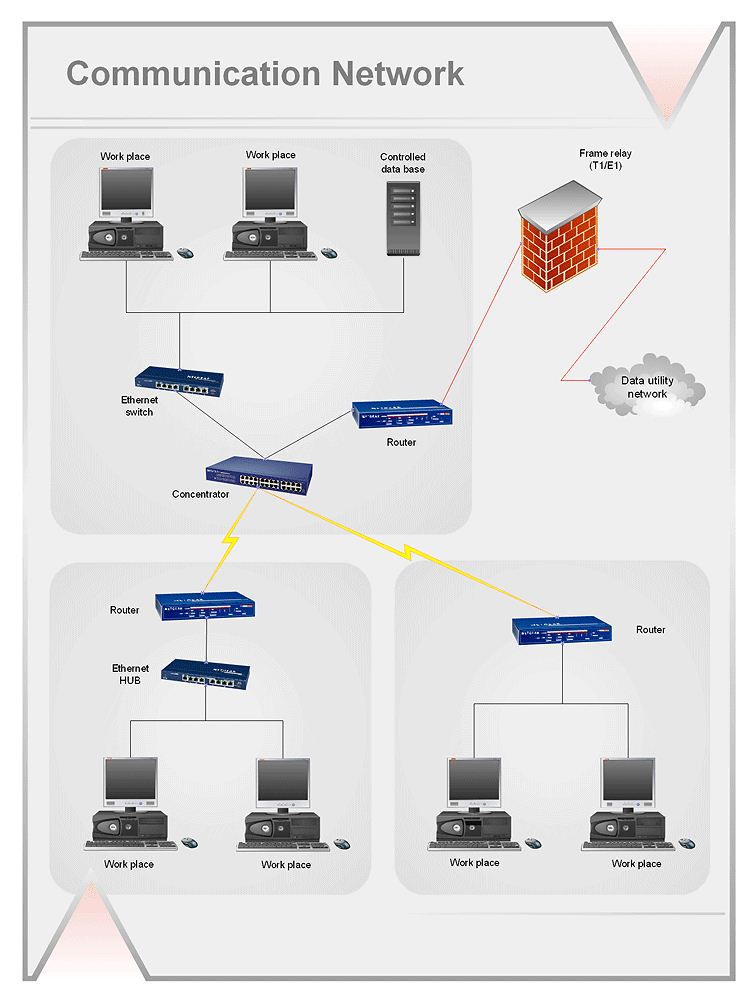
 Computer Network Diagrams
Computer Network Diagrams solution extends ConceptDraw DIAGRAM software with samples, templates and libraries of vector icons and objects of computer network devices and network components to help you create professional-looking Computer Network Diagrams, to plan simple home networks and complex computer network configurations for large buildings, to represent their schemes in a comprehensible graphical view, to document computer networks configurations, to depict the interactions between network's components, the used protocols and topologies, to represent physical and logical network structures, to compare visually different topologies and to depict their combinations, to represent in details the network structure with help of schemes, to study and analyze the network configurations, to communicate effectively to engineers, stakeholders and end-users, to track network working and troubleshoot, if necessary.
- Communication Circle Diagram
- Draw Communication Cycle
- Explain A Circular Flow Of Communication
- Draw And Describe Communication Cycle
- Communication Circle
- Draw The Chart Showing The Communication Process
- Circle Of Communication
- Draw Structure Of Communication Process And Examples
- Process Flowchart | Draw Flowcharts with ConceptDraw | What is ...
- Pie Chart Bussiness Communication