Process Flowchart


Draw Company Structure with Organization Charting Software

Draw Company Structure Diagram - get the detailed information about the company structure and hierarchy - who execute what tasks and who is in charge at this company. This information shows the reasoning and success of business and is indispensable for investors and financial institutions.
This example of UML class diagram models bank account system.
"A bank account is a financial account between a bank customer and a financial institution. A bank account can be a deposit account, a credit card, or any other type of account offered by a financial institution. The financial transactions which have occurred within a given period of time on a bank account are reported to the customer on a bank statement and the balance of the account at any point in time is the financial position of the customer with the institution. a fund that a customer has entrusted to a bank and from which the customer can make withdrawals." [Bank account. Wikipedia]
This bank account system UML class diagram example was created using the ConceptDraw PRO diagramming and vector drawing software extended with the ATM UML Diagrams solution from the Software Development area of ConceptDraw Solution Park.
UML class diagram of bank account system

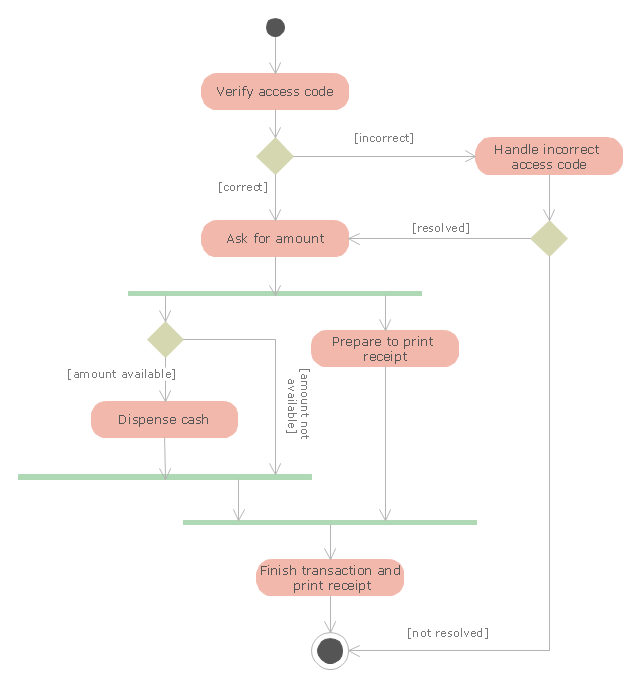
"An automated teller machine or automatic teller machine" (ATM) (American, Australian, Singaporean, Indian, and Hiberno-English), also known as an automated banking machine (ABM) (Canadian English), cash machine, cashpoint, cashline or hole in the wall (British, South African, and Sri Lankan English), is an electronic telecommunications device that enables the clients of a financial institution to perform financial transactions without the need for a cashier, human clerk or bank teller.
On most modern ATMs, the customer is identified by inserting a plastic ATM card with a magnetic stripe or a plastic smart card with a chip that contains a unique card number and some security information such as an expiration date or CVVC (CVV). Authentication is provided by the customer entering a personal identification number (PIN). The newest ATM at Royal Bank of Scotland allows customers to withdraw cash up to £100 without a card by inputting a six-digit code requested through their smartphones.
Using an ATM, customers can access their bank accounts in order to make cash withdrawals, get debit card cash advances, and check their account balances as well as purchase pre-paid mobile phone credit. If the currency being withdrawn from the ATM is different from that which the bank account is denominated in (e.g.: Withdrawing Japanese yen from a bank account containing US dollars), the money will be converted at an official wholesale exchange rate. Thus, ATMs often provide one of the best possible official exchange rates for foreign travellers, and are also widely used for this purpose." [Automated teller machine. Wikipedia]
The UML activity diagram example "Cash withdrawal from ATM" was created using the ConceptDraw PRO diagramming and vector drawing software extended with the Rapid UML solution from the Software Development area of ConceptDraw Solution Park.
UML activity diagram
Cross-Functional Flowchart


Material Requisition Flowchart. Flowchart Examples

The Best Drawing Program for Mac

Pyramid Diagram

Flowchart Symbols Accounting. Activity-based costing (ABC) flowchart

Types of Flowchart - Overview


Business - Design Elements

Workflow Diagram Examples

 Venn Diagrams
Venn Diagrams are actively used to illustrate simple set relationships in set theory and probability theory, logic and statistics, mathematics and computer science, linguistics, sociology, and marketing. Venn Diagrams are also often used to visually summarize the status and future viability of a project.
The Best Mac Software for Diagramming or Drawing


- Diagram And Graph Of Financial Institutions Investment
- Financial Institution Drawing
- Financial Institution Organusatuon Chart Diagram
- Organizational Structure | How to Draw an Organization Chart ...
- Class UML Diagram for Bank Account System | Financial Trade UML ...
- Uml Diagrams For Personal Finance Manager
- Diagram Showing Organizational Structure Of Financial Institution
- Financial Institutions Flowchart
- How to Draw an Organization Chart | Examples of Flowcharts, Org ...
- Draw A Block Diagram Of Financial System
- Structure Of Financial Institutions With Graph
- Draw A Diagram To Represent The Records Life Cycle
- Draw A Uml Class Diagram For Opening A Bank Account
- Enterprise Architecture Diagrams | Example of DFD for Online Store ...
- Block Diagram Of Institutions
- How To Open A Bank Account Using Class Diagram
- Draw The Diagram For Levels Of Management
- Draw Company Structure with Organization Charting Software | UML ...
- Class UML Diagram for Bank Account System | UML package ...