How to Draw a Computer Network Diagrams
HelpDesk
Downloading the Old Versions of ConceptDraw products

Entity Relationship Diagram Symbols

The vector stencils library "IVR computer" contains 27 interactive voice response (IVR) computer icons.
Use it to design your IVR diagrams with ConceptDraw PRO diagramming and vector drawing software.
The vector stencils library "IVR computer" is included in the Interactive Voice Response Diagrams solution from the Computer and Networks area of ConceptDraw Solution Park.
Use it to design your IVR diagrams with ConceptDraw PRO diagramming and vector drawing software.
The vector stencils library "IVR computer" is included in the Interactive Voice Response Diagrams solution from the Computer and Networks area of ConceptDraw Solution Park.
Access denied

Add server

All-in-one desktop computer

Computer file

CPU

Data exchange

Data restore

Desktop computer

Email

e-Mail

Floppy disk

Headphones

Headset

Keyboard

Laptop

LCD monitor

Lock

Locked laptop

Mini tower case

Monitor

Notebook

PC

Remove server

Server

Settings

Touchscreen

Unlock

Data Flow Diagram

Flow Chart Symbols

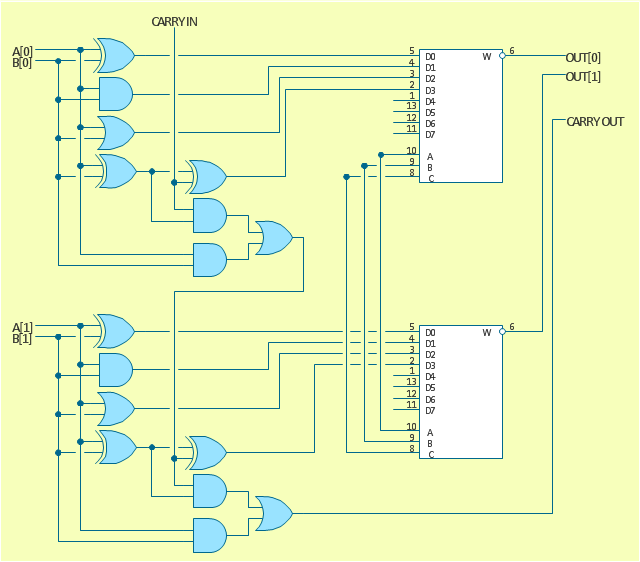
The logic gate diagram example "2-bit ALU" was redesigned from the Wikimedia Commons file: 2-bit ALU.svg.
[commons.wikimedia.org/ wiki/ File:2-bit_ ALU.svg]
This file is licensed under the Creative Commons Attribution-Share Alike 3.0 Unported license. [creativecommons.org/ licenses/ by-sa/ 3.0/ deed.en]
"In digital electronics, an arithmetic and logic unit (ALU) is a digital circuit that performs integer arithmetic and logical operations. The ALU is a fundamental building block of the central processing unit of a computer, and even the simplest microprocessors contain one for purposes such as maintaining timers. The processors found inside modern CPUs and graphics processing units (GPUs) accommodate very powerful and very complex ALUs; a single component may contain a number of ALUs. ...
Most of a processor's operations are performed by one or more ALUs. An ALU loads data from input registers. Then an external control unit tells the ALU what operation to perform on that data, and then the ALU stores its result into an output register. The control unit is responsible for moving the processed data between these registers, ALU and memory." [Arithmetic logic unit. Wikipedia]
The logic gate diagram example "2-bit ALU" was created using the ConceptDraw PRO diagramming and vector drawing software extended with the Electrical Engineering solution from the Engineering area of ConceptDraw Solution Park.
Logic gate diagram
The vector stencils library "IVR computer" contains 27 interactive voice response (IVR) computer icons.
Use it to design your IVR diagrams with ConceptDraw PRO diagramming and vector drawing software.
The vector stencils library "IVR computer" is included in the Interactive Voice Response Diagrams solution from the Computer and Networks area of ConceptDraw Solution Park.
Use it to design your IVR diagrams with ConceptDraw PRO diagramming and vector drawing software.
The vector stencils library "IVR computer" is included in the Interactive Voice Response Diagrams solution from the Computer and Networks area of ConceptDraw Solution Park.
Access denied
Add server
All-in-one desktop computer
Computer file
CPU
Data exchange
Data restore
Desktop computer
Email
e-Mail
Floppy disk
Headphones
Headset
Keyboard
Laptop
LCD monitor
Lock
Locked laptop
Mini tower case
Monitor
Notebook
PC
Remove server
Server
Settings
Touchscreen
Unlock
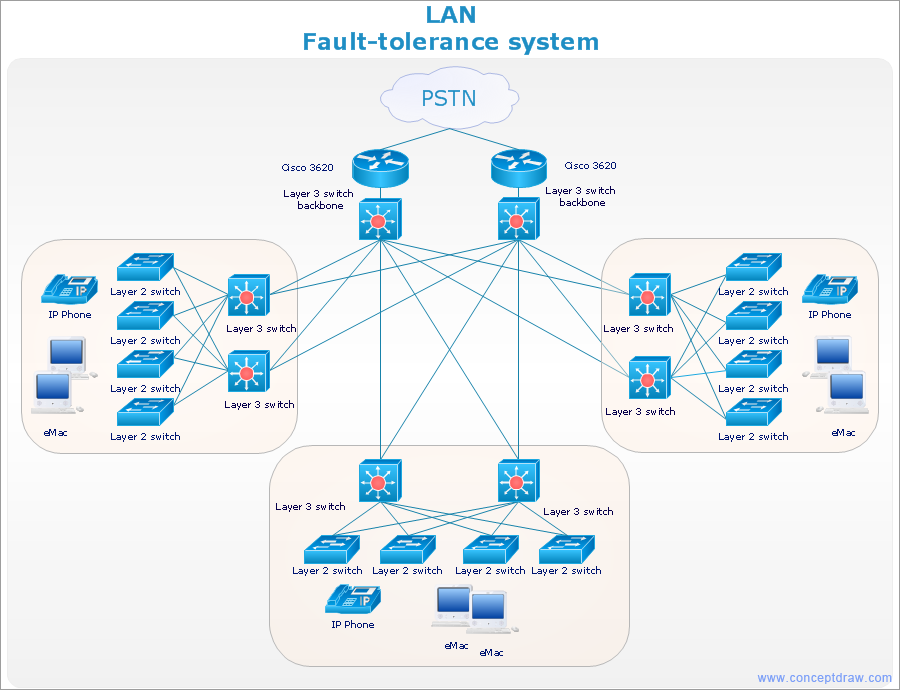
 Computer Network Diagrams
Computer Network Diagrams solution extends ConceptDraw DIAGRAM software with samples, templates and libraries of vector icons and objects of computer network devices and network components to help you create professional-looking Computer Network Diagrams, to plan simple home networks and complex computer network configurations for large buildings, to represent their schemes in a comprehensible graphical view, to document computer networks configurations, to depict the interactions between network's components, the used protocols and topologies, to represent physical and logical network structures, to compare visually different topologies and to depict their combinations, to represent in details the network structure with help of schemes, to study and analyze the network configurations, to communicate effectively to engineers, stakeholders and end-users, to track network working and troubleshoot, if necessary.
The vector stencils library "Hardware" contains 32 computer hardware and telecommunication equipment icons.
Use it to design your computing and telecom illustrations and infographics with ConceptDraw PRO diagramming and vector drawing software.
The vector stencils library "Hardware" is included in the Computers and Communications solution from the Illustration area of ConceptDraw Solution Park.
Use it to design your computing and telecom illustrations and infographics with ConceptDraw PRO diagramming and vector drawing software.
The vector stencils library "Hardware" is included in the Computers and Communications solution from the Illustration area of ConceptDraw Solution Park.
Rack

Workstation

Monitor with keyboard

Laptop

Laptop settings

Keyboard connection

Keyboard with mouse

Keyboard

USB computer mouse

WiFi mouse

Webcam

Remote control

Hard drive

Flash drive

Floppy

CPU

Hard drive

SD card

8GB memory card

Battery

Battery charging

Accumulator

Cable connector

Power socket

Power plug

USB cable

Electric bulb

Voltage meter

Speed control

Router

Modem

Bluetooth device