Entity Relationship Diagram Symbols
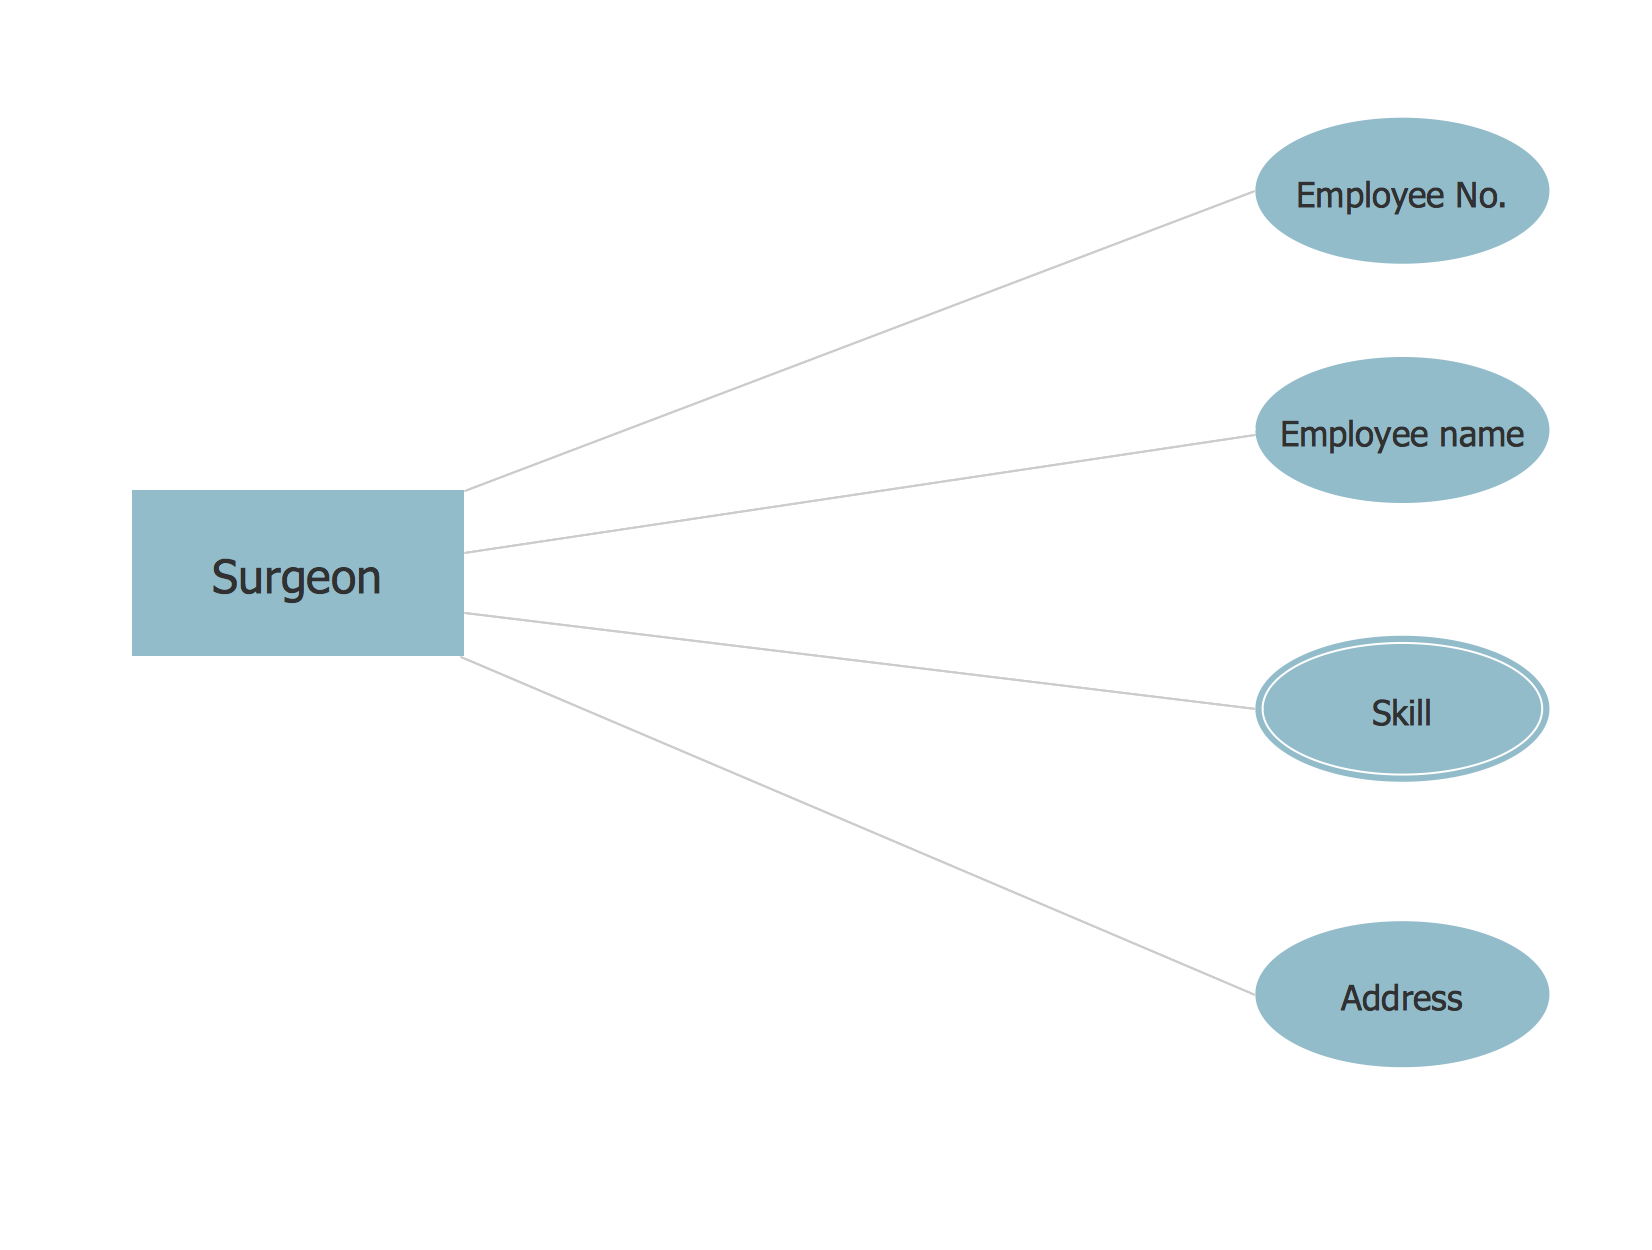
The semantic modeling method nowadays is successfully applied in database structure design. It is effective method of modeling the data structures, which is based on the meaning of these data. As a tool of semantic modeling, there are used different types of Entity-Relationship Diagrams. Entity Relationship Diagram (ERD) is applied to visually and clearly represent a structure of a business database. The main components of ERDs are: entity, relation and attributes. An entity is a class of similar objects in the model, each entity is depicted in the form of rectangle and has the name expressed by a noun. Relation is shown in the form of non-directional line that connects two entities. There are several notation styles used for ERDs: information engineering style, Chen style, Bachman style, Martin Style. The Entity Relationship Diagram symbols used for professional ERD drawing are predesigned by professionals and collected in the libraries of the Entity-Relationship Diagram (ERD) solution for ConceptDraw DIAGRAM software.Chen ERD Diagram
The vector stencils library Chen ERD from the solution Entity-Relationship Diagrams (ERD) contains specific symbols of the Chen ERD notation including entity symbols and relationship symbols for ConceptDraw DIAGRAM diagramming and vector drawing software. The Entity-Relationship Diagrams (ERD) solution is contained in the Software Development area of ConceptDraw Solution Park.Martin ERD Diagram
The vector stencils library Crow's Foot Notation from the solution Entity-Relationship Diagrams (ERD) contains specific symbols of the Crow's foot notation such as relationship symbols and entity symbols for ConceptDraw DIAGRAM diagramming and vector drawing software. The Entity-Relationship Diagrams (ERD) solution is contained in the Software Development area of ConceptDraw Solution Park.
 Entity-Relationship Diagram (ERD)
An Entity-Relationship Diagram (ERD) is a visual presentation of entities and relationships. That type of diagrams is often used in the semi-structured or unstructured data in databases and information systems. At first glance ERD is similar to a flowch
Design Elements for UML Diagrams
The Rapid UML solution from Software Development area of ConceptDraw Solution Park includes 13 vector stencils libraries for drawing the UML 2.4 diagrams using ConceptDraw DIAGRAM diagramming and vector drawing software.Bubble Chart
How to design a Bubble Chart? It’s very easy! All that you need is a powerful software. Never before creation of a Bubble Chart wasn’t so easy as now with tools of Bubble Diagrams Solution from the "Diagrams" Area for ConceptDraw Solution Park.Best Diagramming Software for macOS
ConceptDraw DIAGRAM creates drawings, flowcharts, block diagrams, bar charts, histograms, pie charts, divided bar diagrams, line graphs, area charts, scatter plots, circular arrows diagrams, Venn diagrams, bubble diagrams with great visual appeal on Mac OS X.
 Family Tree
Family Tree solution with included vector design shapes for drawing family trees, pedigree chart symbols, photo blocks of different detailing and professionally designed samples, extends the functionality of ConceptDraw DIAGRAM software making it the best family tree maker and easy-to-use ancestry trees designer program for researchers, scientists, historians, genetics, medics, archeologists, and other stakeholders. Use it to design informative and colorful genealogy trees, simple family tree or extensive ancestry tree of any depth, genealogy schematics and illustrations with family trees.
Pyramid Diagram
The purchase or purchasing funnel is a consumer focused marketing model which illustrates the theoretical customer journey towards the purchase of a product or service.- Explain The Symbols For Expressing Relations Among Data
- Chen ERD Diagram | Entity- Relationship Diagram (ERD) | Design ...
- Entity Relationship Diagram Symbols | EXPRESS-G data Modeling ...
- ERD Symbols and Meanings | Entity Relationship Diagram Symbols ...
- How To Make Chen ER Diagram | Entity Relationship Diagram ...
- ERD Symbols and Meanings | Design Element: Crows Foot for Entity ...
- ERD Symbols and Meanings | Entity Relationship Diagram Symbols ...
- Basic Flowchart Symbols and Meaning | Flow Chart Symbols ...
- ERD Symbols and Meanings | Design elements - ERD (crow's foot ...
- Entity Relationship Diagram Symbols | Basic Flowchart Symbols and ...
- Entity Relationship Diagram Symbols | ERD Symbols and Meanings ...
- ERD Symbols and Meanings | Entity Relationship Diagram Symbols ...
- Entity Relationship Diagram Symbols | Martin ERD Diagram | Data ...
- Entity- Relationship Diagram (ERD) with ConceptDraw DIAGRAM ...
- Professional Diagram and Flowchart Software | Components of ER ...
- Facebook Database Er Diagram
- ERD Symbols and Meanings | How to Add a Concept Map to MS ...
- Process Flowchart | Basic Flowchart Symbols and Meaning | Types ...
- Entity Relationship Diagram Examples | | Database Flowchart ...
- Entity Relationship Diagram Symbols | Martin ERD Diagram | UML ...


