Bar Diagram Math

Rainfall Bar Chart

Chart Software for Better Presentations

Bar Graph

Bar Chart

Picture Graph

 Divided Bar Diagrams
The Divided Bar Diagrams Solution extends the capabilities of ConceptDraw PRO v10 with templates, samples, and a library of vector stencils for drawing high impact and professional Divided Bar Diagrams and Graphs, Bar Diagram Math, and Stacked Graph.
Sales Growth. Bar Graphs Example

Relative Value Chart Software

Pie Donut Chart. Pie Chart Examples

Basic Diagramming


Bar Diagrams for Problem Solving. Create economics and financial bar charts with Bar Graphs Solution

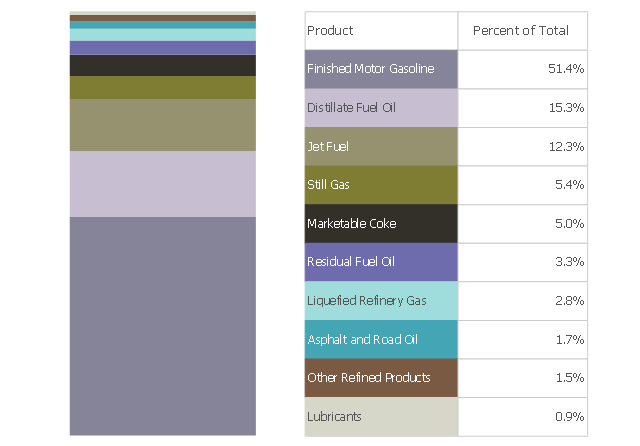
This divided bar chart example was drawn on the base of the picture "Petroleum Products Yielded from One Barrel of Crude Oil in California" from the California Energy Almanac website. [energyalmanac.ca.gov/ gasoline/ whats_ in_ barrel_ oil.html]
"Petroleum products are useful materials derived from crude oil (petroleum) as it is processed in oil refineries. Unlike petrochemicals, which are a collection of well-defined usually pure chemical compounds, petroleum products are complex mixtures. The majority of petroleum is converted to petroleum products, which includes several classes of fuels.
According to the composition of the crude oil and depending on the demands of the market, refineries can produce different shares of petroleum products. The largest share of oil products is used as "energy carriers", i.e. various grades of fuel oil and gasoline. These fuels include or can be blended to give gasoline, jet fuel, diesel fuel, heating oil, and heavier fuel oils. Heavier (less volatile) fractions can also be used to produce asphalt, tar, paraffin wax, lubricating and other heavy oils. Refineries also produce other chemicals, some of which are used in chemical processes to produce plastics and other useful materials. Since petroleum often contains a few percent sulfur-containing molecules, elemental sulfur is also often produced as a petroleum product. Carbon, in the form of petroleum coke, and hydrogen may also be produced as petroleum products. The hydrogen produced is often used as an intermediate product for other oil refinery processes such as hydrocracking and hydrodesulfurization." [Petroleum product. Wikipedia]
The divided bar diagram example "Petroleum products yielded from one barrel of crude oil" was created using the ConceptDraw PRO diagramming and vector drawing software extended with the Divided Bar Diagrams solution from the Graphs and Charts area of ConceptDraw Solution Park.
Divided bar chart
 Picture Graphs
Typically, a Picture Graph has very broad usage. They many times used successfully in marketing, management, and manufacturing. The Picture Graphs Solution extends the capabilities of ConceptDraw PRO v10 with templates, samples, and a library of professionally developed vector stencils for designing Picture Graphs.
Bar Diagrams for Problem Solving. Create space science bar charts with Bar Graphs Solution

- Bar Graphs On Sports
- Bar Diagram Math | Chart Software for Better Presentations | Divided ...
- ConceptDraw Solution Park | Divided Bar Diagrams | Picture Graphs ...
- Bar Graphs | Divided Bar Diagrams | Picture Graphs | How To Draw ...
- The Pictorial Picture Bar Chart And Histogram
- Bar Chart Image
- Online Collaboration via Skype | Bar Graphs | Divided Bar Diagrams ...
- Picture Graph | Continent Maps | Bar Graphs | How To Draw Bar ...
- Picture Graphs | Sales Growth. Bar Graphs Example | Barrie ...
- Picture Graphs | Sales Growth. Bar Graphs Example | Picture Graph ...
- Picture Graphs | Sales Growth. Bar Graphs Example | Picture Graph ...
- Bar Graphs | Divided Bar Diagrams | ConceptDraw Solution Park ...
- Bar Graphs | Divided Bar Diagrams | ConceptDraw Solution Park ...
- Picture Graph | Bar Graphs | Pictures of Graphs | Represent The ...
- Drawing A Divided Bar Graph
- Simple Bar Graphs
- Financial Comparison Chart | Bar Graphs | Divided Bar Diagrams ...
- Bar Graphs | How to Draw a Divided Bar Chart in ConceptDraw PRO ...
- Geo Map - Asia | Picture Graph | Pictures of Graphs | A Bar Graph ...
- London election results - Divided bar diagram | Basic Flowchart ...