This circular arrows diagram sample shows the process of emergency management involving four phases: Mitigation, Preparedness, Response, and Recovery. It was designed on the base of the webpage "Emergency Management" on the website of the Downey City Hall, California, U.S.
"The process of emergency management involves four phases: Mitigation, Preparedness, Response, and Recovery. ...
Mitigation efforts attempt to prevent hazards from developing into disasters altogether, or to reduce the effects of disasters when they occur. The mitigation phase differs from the other phases because it focuses on long-term measures for reducing or eliminating risk. ...
In the preparedness phase, emergency managers develop plans of action for when the disaster strikes. ...
The response phase includes the mobilization of the necessary emergency services and first responders in the disaster area. This is likely to include a first wave of core emergency services, such as firefighters, police and EMS crews. ...
The aim of the recovery phase is to restore the affected area to its previous state. It differs from the response phase in its focus; recovery efforts are concerned with issues and decisions that must be made after immediate needs are addressed. Recovery efforts are primarily concerned with actions that involve rebuilding destroyed property, re-employment, and the repair of other essential infrastructure."
[downeyca.org/ gov/ emergency/ default.asp]
"Disaster management (or emergency management) is the creation of plans through which communities reduce vulnerability to hazards and cope with disasters. Disaster management does not avert or eliminate the threats; instead, it focuses on creating plans to decrease the effect of disasters. Failure to create a plan could lead to human mortality, lost revenue, and damage to assets. Currently in the United States 60 percent of businesses do not have emergency management plans. Events covered by disaster management include acts of terrorism, industrial sabotage, fire, natural disasters (such as earthquakes, hurricanes, etc.), public disorder, industrial accidents, and communication failures." [Emergency management. Wikipedia]
The arrow circle diagram example "Emergency management process" was created using the ConceptDraw PRO diagramming and vector drawing software extended with the Circular Arrows Diagrams solution from the area "What is a Diagram" of ConceptDraw Solution Park.
Arrow circle diagram
Used Solutions
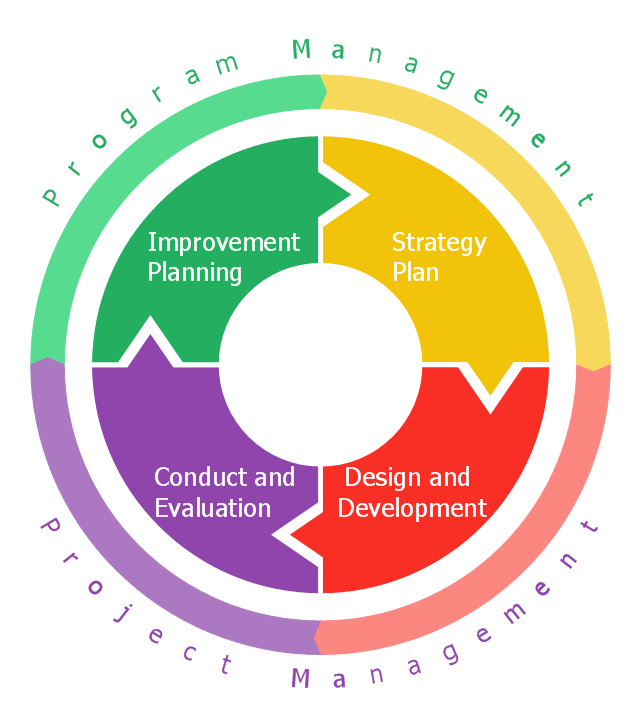
This circular arrows diagram sample shows the exercise cycle stages: 1) Strategy plan, 2) Design and development, 3) Conduct and evaluation, 4) Improvement planning. It was designed on the base of the diagram on the Emergency Management Insitute training IS-120.b webpage from the website of the Federal Emergency Management Agency (FEMA) of the United States Department of Homeland Security.
[emilms.fema.gov/ IS120A/ summary.htm]
"Exercises give communities, states, and regions a set of essential tools to prevent, prepare for, respond to, and recover from disasters." [emilms.fema.gov/ IS120A/ module0.htm]
"Disaster management (or emergency management) is the creation of plans through which communities reduce vulnerability to hazards and cope with disasters. Disaster management does not avert or eliminate the threats; instead, it focuses on creating plans to decrease the effect of disasters. Failure to create a plan could lead to human mortality, lost revenue, and damage to assets. Currently in the United States 60 percent of businesses do not have emergency management plans. Events covered by disaster management include acts of terrorism, industrial sabotage, fire, natural disasters (such as earthquakes, hurricanes, etc.), public disorder, industrial accidents, and communication failures." [Emergency management. Wikipedia]
The diagram example "Emergency management exercise cycle" was created using the ConceptDraw PRO diagramming and vector drawing software extended with the Circular Arrows Diagrams solution from the area "What is a Diagram" of ConceptDraw Solution Park.
Circular arrows diagram
 IDEF0 Diagrams
IDEF0 Diagrams visualize system models using the Integration Definition for Function Modeling (IDEF) methodology. Use them for analysis, development and integration of information and software systems, and business process modelling.
Visual Presentations Made Easy with Diagramming Software


This work flow chart sample was redesigned from the picture "Simulation for earthquake disaster assessment" from the article "Simulation Workflows".
[iaas.uni-stuttgart.de/ forschung/ projects/ simtech/ sim-workflows.php]
" This simulation was developed to have an in depth understanding of the destructions and the decisions to be made in various phases of crisis management (Source: Mahdi Hashemi and Ali A. Alesheikh (2010). "Developing an agent based simulation model for earthquakes in the context of SDI." GSDI 12 World Conference. 19 – 22 October 2010. Singapour). The simulation process contains following major steps:
(1) All spatial information including satellite images (before and after the earthquake) and topographic/ cadastral maps of the area are mosaicked and georeferenced. The parts of the city that contain various levels of destructions are selected. Three types of features namely buildings, roads and recreational areas are classified and extracted from the satellite images.
(2) The governing factors of destructions are identified; a mathematical model that integrates the factors is constructed.
(3) The simulation is constructed for various parameter values (different earthquake strength, time elapses, etc.)" [iaas.uni-stuttgart.de/ forschung/ projects/ simtech/ sim-workflows.php]
The example "Workflow diagram - Earthquake disaster assessment" was drawn using the ConceptDraw PRO diagramming and vector drawing software extended with the Workflow Diagrams solution from the Business Processes area of ConceptDraw Solution Park.
Work flow chart

 Workflow Diagrams
Workflow Diagrams solution extends ConceptDraw PRO software with samples, templates and vector stencils library for drawing the work process flowcharts.
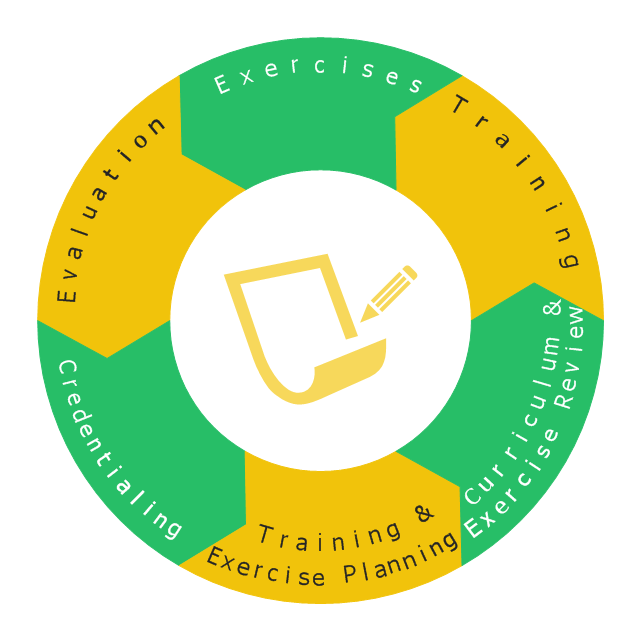
This wheel diagram sample illustrates the emergency preparedness training and exercise processes. It was designed on the base of the diagram on the webpage "Public Health Preparedness Training and Exercise" from the FloridaHealth website of the Florida Department of Health. [floridahealth.gov/ programs-and-services/ emergency-preparedness-and-response/ training-exercise/ ]
"Emergency Preparedness is the discipline of dealing with and avoiding both natural and manmade disasters. It involves mitigation, preparedness, response and recovery in order to lessen the impact of disasters. Emergency management requires a partnership among all levels of government (local, State, and Federal) and the private sector (business and industry, voluntary organizations, and the public). Successful preparedness requires detailed planning and cooperation among each sector." [Emergency Preparedness. Wikipedia]
The arrow donut chart example "Training and exercise process wheel" was created using the ConceptDraw PRO diagramming and vector drawing software extended with the Circular Arrows Diagrams solution from the area "What is a Diagram" of ConceptDraw Solution Park.
Circular arrows diagram
Used Solutions
This arrow ring chart sample was created on the base of the figure illustrating the webpage "National Preparedness Cycle. Plan" from the Federal Emergency Management Agency (FEMA) website. "Planning makes it possible to manage the entire life cycle of a potential crisis. Strategic and operational planning establishes priorities, identifies expected levels of performance and capability requirements, provides the standard for assessing capabilities and helps stakeholders learn their roles. The planning elements identify what an organization’s Standard Operating Procedures (SOPs) or Emergency Operations Plans (EOPs) should include for ensuring that contingencies are in place for delivering the capability during a large-scale disaster." [fema.gov/ plan]
The arrow ring chart example "National Preparedness Cycle" was created using the ConceptDraw PRO diagramming and vector drawing software extended with the Target and Circular Diagrams solution from the Marketing area of ConceptDraw Solution Park.
www.conceptdraw.com/ solution-park/ marketing-target-and-circular-diagrams
Arrow ring chart
Types of Flowchart - Overview


Flow chart Example. Warehouse Flowchart


 Network Security Diagrams
The Network Security Diagrams solution presents a large collection of predesigned cybersecurity vector stencils, cliparts, shapes, icons and connectors to help you succeed in designing professional and accurate Network Security Diagrams, Network Security Infographics to share knowledge about effective ways of networks protection with help of software and network security devices of different cyber security degrees, Network Plans for secure wireless network, Computer Security Diagrams to visually tell about amazing possibilities of IT security solutions. The samples and examples reflect the power of ConceptDraw PRO software in drawing Network Security Diagrams, give the representation about variety of existing types of attacks and threats, help to realize their seriousness and the methods to deal with them.
 Cross-Functional Flowcharts
Cross-functional flowcharts are powerful and useful tool for visualizing and analyzing complex business processes which requires involvement of multiple people, teams or even departments. They let clearly represent a sequence of the process steps, the order of operations, relationships between processes and responsible functional units (such as departments or positions).
ConceptDraw Arrows10 Technology

Work Flow Diagram

ConceptDraw PRO Compatibility with MS Visio

- Circular Model Diagram In Disaster Management
- Disaster Management Of Project Topic Tree Diagrams And Flowcharts
- Charts On Disaster Management Pie Chart By Diagram
- Diagrams For Disaster Management
- Chart Of Disaster Management
- Disaster Management Cycle Draw A Flowchart And Describe It
- Types of Flowchart - Overview | Circular Arrows Diagrams | Maths In ...
- Charts On Disaster Management
- Disaster Management For Maths Pie Chart
- Chart Drawing In Disaster Management
- Emergency management exercise cycle | National Preparedness ...
- Disaster Management Of Bar Graph
- Chart On Disaster Management
- Emergency management exercise cycle | National Preparedness ...
- Chemical and Process Engineering | Emergency management ...
- Graph In Disaster Management
- Pie Charts Related To Disaster Management
- Emergency management exercise cycle | Calendars | Pie Chart For ...
- Emergency management exercise cycle | Emergency Plan | Chart ...
- Pie Chart On Disaster Management