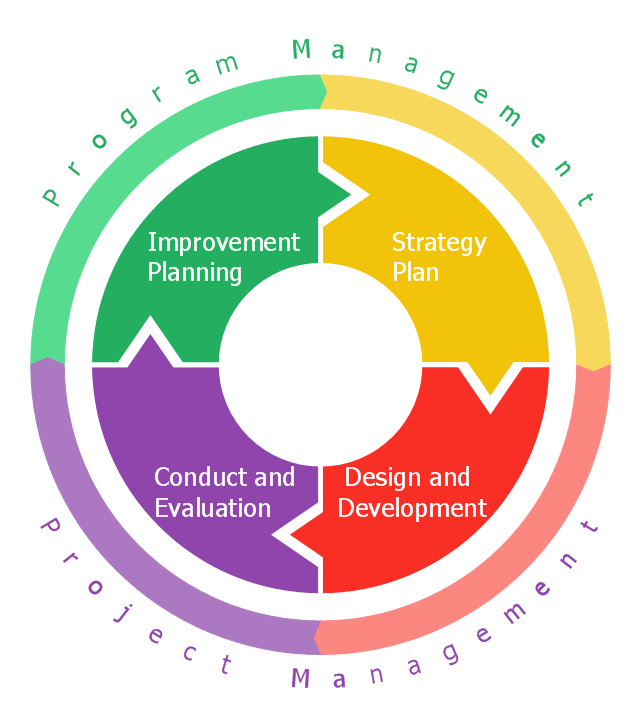
This circular arrows diagram sample shows the exercise cycle stages: 1) Strategy plan, 2) Design and development, 3) Conduct and evaluation, 4) Improvement planning. It was designed on the base of the diagram on the Emergency Management Insitute training IS-120.b webpage from the website of the Federal Emergency Management Agency (FEMA) of the United States Department of Homeland Security.
[emilms.fema.gov/ IS120A/ summary.htm]
"Exercises give communities, states, and regions a set of essential tools to prevent, prepare for, respond to, and recover from disasters." [emilms.fema.gov/ IS120A/ module0.htm]
"Disaster management (or emergency management) is the creation of plans through which communities reduce vulnerability to hazards and cope with disasters. Disaster management does not avert or eliminate the threats; instead, it focuses on creating plans to decrease the effect of disasters. Failure to create a plan could lead to human mortality, lost revenue, and damage to assets. Currently in the United States 60 percent of businesses do not have emergency management plans. Events covered by disaster management include acts of terrorism, industrial sabotage, fire, natural disasters (such as earthquakes, hurricanes, etc.), public disorder, industrial accidents, and communication failures." [Emergency management. Wikipedia]
The diagram example "Emergency management exercise cycle" was created using the ConceptDraw PRO diagramming and vector drawing software extended with the Circular Arrows Diagrams solution from the area "What is a Diagram" of ConceptDraw Solution Park.
Circular arrows diagram
 Basic Pie Charts
This solution extends the capabilities of ConceptDraw DIAGRAM (or later) with templates, samples, and a library of vector stencils for drawing pie and donut charts.
 Pie Charts
Pie Charts are extensively used in statistics and business for explaining data and work results, in mass media for comparison (i.e. to visualize the percentage for the parts of one total), and in many other fields. The Pie Charts solution for ConceptDraw DIAGRAM offers powerful drawing tools, varied templates, samples, and a library of vector stencils for simple construction and design of Pie Charts, Donut Chart, and Pie Graph Worksheets.
Tools to Create Your Own Infographics

 ConceptDraw Solution Park
ConceptDraw Solution Park collects graphic extensions, examples and learning materials
Family Emergency Plan

Swim Lane Diagrams

 Fire and Emergency Plans
It's a good idea to have an emergency exit strategy in place for your home or business. ConceptDraw gives you the tools to create your own fire and emergency plan, tailored to your setting.
Basic Diagramming


 Organizational Charts
Organizational Charts solution extends ConceptDraw DIAGRAM software with samples, templates and library of vector stencils for drawing the org charts.
 Management Area
The solutions from Management area of ConceptDraw Solution Park collect templates, samples and libraries of vector stencils for drawing the management diagrams and mind maps.
 25 Typical Orgcharts
The 25 Typical Orgcharts solution contains powerful organizational structure and organizational management drawing tools, a variety of professionally designed organization chart and matrix organization structure samples, 25 templates based on various orga
- Bar Graphs | Disaster Management
- Mathematics | Pie Charts | Venn Diagrams | Disaster Management ...
- Charts On Disaster Management Pie Chart By Diagram
- Pie Chart Or Graph Of Disaster Management
- Draw A Flowchart For Disaster Management Cycle
- Graphs And Pie Charts About Disaster Management
- Disaster Management Cycle Draw A Flowchart And Describe It
- Bar Graph And Pie Diagrams For Disaster Management
- Pie Chart On Disaster Management
- Disaster Management Chart And Diagrams
- Bargraph About Disaster Management
- Drawings For Disaster Management
- Flow Chart And Pie Chart Of Disaster Management
- Disaster Management Of Bar Graph
- Datas Flow Charts Pie Charts Related To Crisis Management
- Disaster Management Related Diagram
- Disaster Management For Chart Making
- Chart Drawing In Disaster Management
- Disaster Management Drawings
- Www Disaster Management Cycle Draw Flow Chart