ER Diagram Styles

Entity Relationship Diagram Symbols

Chen ERD Diagram

Martin ERD Diagram

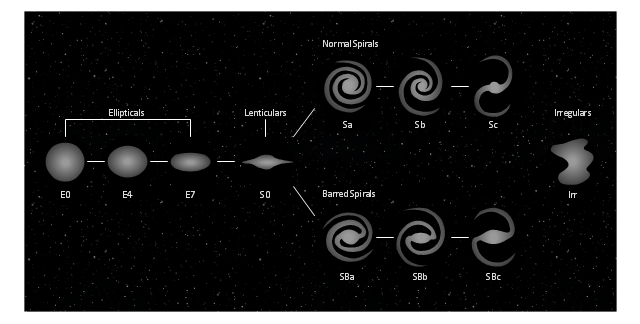
This tuning-fork style diagram of the Hubble sequence was created on the base of the Wikimedia Commons file: Hubble sequence photo.png. [commons.wikimedia.org/ wiki/ File:Hubble_ sequence_ photo.png]
"The Hubble sequence is a morphological classification scheme for galaxies invented by Edwin Hubble in 1936. It is often known colloquially as the Hubble tuning fork diagram because of the shape in which it is traditionally represented.
Hubble’s scheme divides regular galaxies into 3 broad classes - ellipticals, lenticulars and spirals - based on their visual appearance (originally on photographic plates). A fourth class contains galaxies with an irregular appearance. To this day, the Hubble sequence is the most commonly used system for classifying galaxies, both in professional astronomical research and in amateur astronomy." [Hubble sequence. Wikipedia]
The astronomical diagram example "Tuning-fork style diagram of the Hubble sequence" was created using the ConceptDraw PRO diagramming and vector drawing software extended with the Astronomy solution from the Science and Education area of ConceptDraw Solution Park.
Morphological classification scheme for galaxies
 Circular Arrows Diagrams
Circular Arrows Diagrams solution extends ConceptDraw DIAGRAM with extensive drawing tools, predesigned samples, Circular flow diagram template for quick start, and a library of ready circular arrow vector stencils for drawing Circular Arrow Diagrams, Segmented Cycle Diagrams, and Circular Flow Diagrams. The elements in this solution help managers, analysts, business advisers, marketing experts, scientists, lecturers, and other knowledge workers in their daily work.
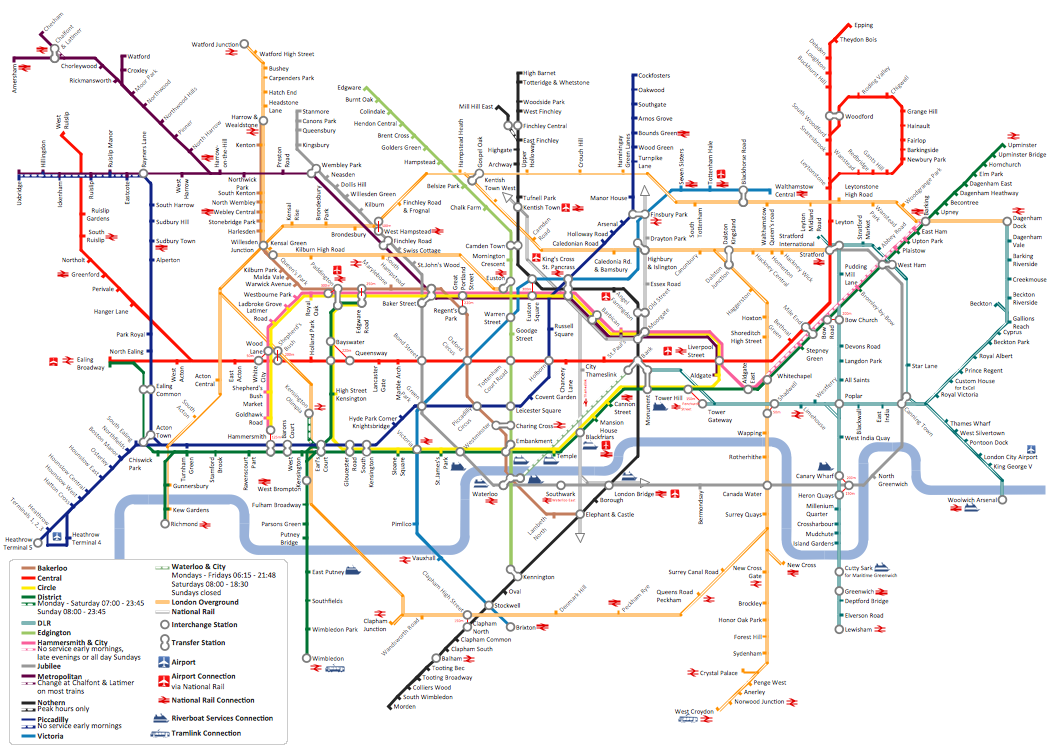
How to draw Metro Map style infographics? (London)
 Enterprise Architecture Diagrams
Enterprise Architecture Diagrams solution extends ConceptDraw DIAGRAM software with templates, samples and library of vector stencils for drawing the diagrams of enterprise architecture models.
How to draw Metro Map style infographics? (Los Angeles)

- Entity-Relationship Diagram (ERD) | Software development with ...
- Entity Relationship Diagram Symbols | Drawing ER diagrams on a ...
- Entity-Relationship Diagram (ERD) | Software development with ...
- Martin Style Er Diagram
- Martin ERD Diagram | Chen ERD Diagram | Entity Relationship ...
- ER Diagram Styles | Entity Relationship Diagram Symbols | Martin ...
- Chen Notation | Design elements - ER diagram (Chen notation ...
- User Password Management, Custom- style Maps, Project Diagrams ...
- Entity Relationship Diagram Symbols | ERD Symbols and Meanings ...
- Design elements - ERD (crow's foot notation) | Entity Relationship ...