Use this circle chart template to design your sector diagrams.
"A chart is a graphical representation of data, in which the data is represented by symbols, such as ... slices in a pie chart. ... Charts are often used to ease understanding ... the relationships between parts of the data. ... For example, data that presents percentages in different groups (such as "satisfied, not satisfied, unsure") are often displayed in a pie chart ... A pie chart shows percentage values as a slice of a pie." [Chart. Wikipedia]
The template "Sector diagram" for the ConceptDraw PRO diagramming and vector drawing software is included in the Pie Charts solution of the Graphs and Charts area in ConceptDraw Solution Park.
Circle chart

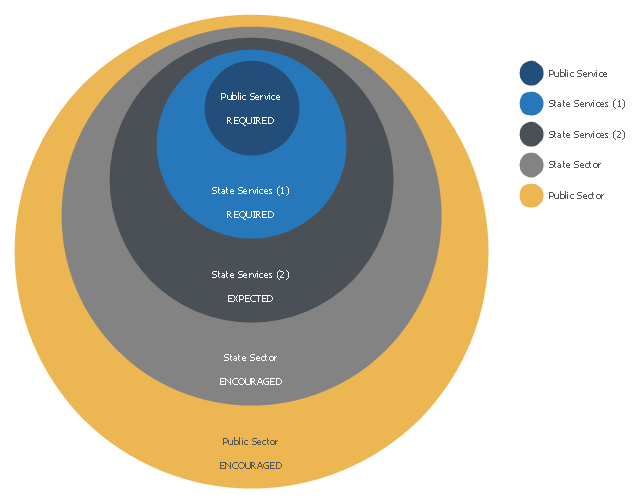
This onion diagram example was designed on the base of figure in the article "Public Sector Agencies" on the website "New Zealand Government Procurement"
[business.govt.nz/ procurement/ for-agencies/ key-guidance-for-agencies/ public-sector-agencies]
"Public sector organisations in New Zealand include the State sector plus the organisations of local government.
Within the State sector lies the State services, and within this, lies the core Public service." [Public sector organisations in New Zealand. Wikipedia]
The example "New Zealand Public Sector Agencies onion diagram" was drawn using the ConceptDraw PRO software extended with the Stakeholder Onion Diagrams solution from the Management area of ConceptDraw Solution Park.
Onion diagram example
Process Flowchart


How To Create Onion Diagram

Bar Diagrams for Problem Solving. Create manufacturing and economics bar charts with Bar Graphs Solution

Pie Chart Examples and Templates

Lean Six Sigma Diagram Software

Bar Diagrams for Problem Solving. Create event management bar charts with Bar Graphs Solution

 Stakeholder Onion Diagrams
The Stakeholder Onion Diagram is often used as a way to view the relationships of stakeholders to a project goal. A basic Onion Diagram contains a rich information. It shows significance of stakeholders that will have has influence to the success achieve
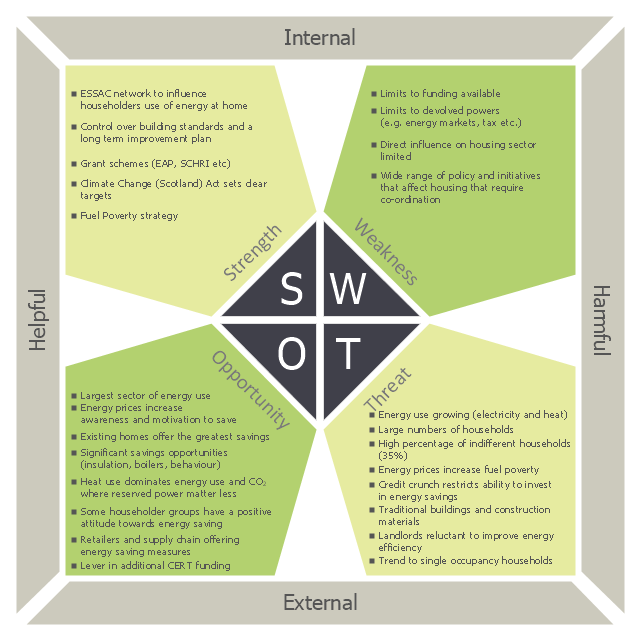
This sample was created on the base of the SWOT matrix illustrating the webpage "SWOT Analysis" of "Scottish Energy Study Volume 4: Issues, Opportunities and Barriers" from the website of the Scottish Government. [scotland.gov.uk/ Publications/ 2009/ 09/ 24094712/ 6]
The diagram example "Domestic sector SWOT" was created using the ConceptDraw PRO diagramming and vector drawing software extended with the SWOT Analysis solution from the Management area of ConceptDraw Solution Park.
The diagram example "Domestic sector SWOT" was created using the ConceptDraw PRO diagramming and vector drawing software extended with the SWOT Analysis solution from the Management area of ConceptDraw Solution Park.
SWOT matrix
Pie Chart Examples and Templates
Stakeholder Onion Diagram Template

Onion Diagram Process Design

Types of Flowcharts


Basic Diagramming


- Sector diagram - Template | Economic sector weightings | New ...
- Sector diagram - Template | Process Flowchart | How To Create ...
- Business Sector Diagram Sample
- Sector diagram - Template | New Zealand Public Sector Agencies ...
- Sector diagram - Template | How To Create Onion Diagram ...
- Pie Charts | Pie Chart Examples and Templates | Sector diagram ...
- Fishbone Diagram Of Telecom Sector Ppt
- Business Sector Draw A Diagram Of Each Sector
- Telecommunication Sector Diagram
- Economic sector weightings | Stakeholder Onion Diagrams ...
- Stakeholder Onion Diagrams | Flow Chart Of The Primary Sector ...
- Fishbone Diagram Example For Service Industry
- Stakeholder Onion Diagrams | Draw A Flow Chart To Show The ...
- Sector diagram - Template | How To Create Onion Diagram | Pie ...
- Sector diagram - Template | Stakeholder Onion Diagrams | How To ...
- Economic sector weightings | Divided Bar Diagrams | Stakeholder ...
- Sector Diagram And Block Pie Diagram
- Primary Secondary And Tertiary Sectors Of Clothing In Diagrams
- Show Diagram For Secondary Sector
- Basic Flowchart Symbols and Meaning | Economic sector ...