 Fishbone Diagram
Fishbone Diagrams solution extends ConceptDraw DIAGRAM software with templates, samples and library of vector stencils for drawing the Ishikawa diagrams for cause and effect analysis.
 Entity-Relationship Diagram (ERD)
Entity-Relationship Diagram (ERD) solution extends ConceptDraw DIAGRAM software with templates, samples and libraries of vector stencils from drawing the ER-diagrams by Chen's and crow’s foot notations.
 Event-driven Process Chain Diagrams
Event-Driven Process Chain Diagrams solution extends ConceptDraw DIAGRAM functionality with event driven process chain templates, samples of EPC engineering and modeling the business processes, and a vector shape library for drawing the EPC diagrams and EPC flowcharts of any complexity. It is one of EPC IT solutions that assist the marketing experts, business specialists, engineers, educators and researchers in resources planning and improving the business processes using the EPC flowchart or EPC diagram. Use the EPC solutions tools to construct the chain of events and functions, to illustrate the structure of a business process control flow, to describe people and tasks for execution the business processes, to identify the inefficient businesses processes and measures required to make them efficient.
Network Diagram Examples


 Cross-Functional Flowcharts
Cross-functional flowcharts are powerful and useful tool for visualizing and analyzing complex business processes which requires involvement of multiple people, teams or even departments. They let clearly represent a sequence of the process steps, the order of operations, relationships between processes and responsible functional units (such as departments or positions).
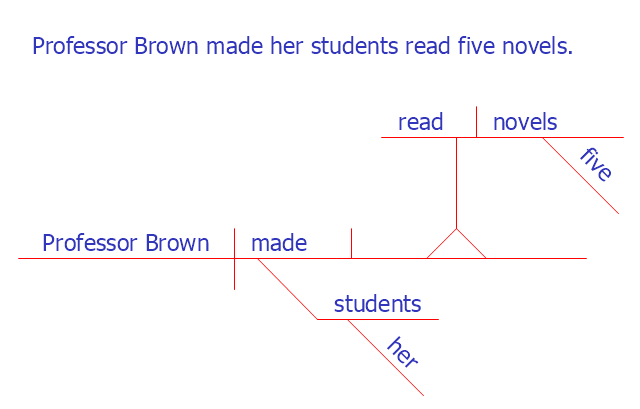
"A sentence is a grammatical unit consisting of one or more words that are grammatically linked. A sentence can include words grouped meaningfully to express a statement, question, exclamation, request, command or suggestion.
A sentence can also be defined in orthographic terms alone, i.e., as anything which is contained between a capital letter and a full stop. ...
As with all language expressions, sentences might contain function and content words and contain properties distinct to natural language, such as characteristic intonation and timing patterns.
Sentences are generally characterized in most languages by the presence of a finite verb..." [Sentence (linguistics). Wikipedia]
This sentence diagram sample was created using the ConceptDraw PRO diagramming and vector drawing software extended with the Language Learning solution from the Science and Education area of ConceptDraw Solution Park.
Sentence diagram
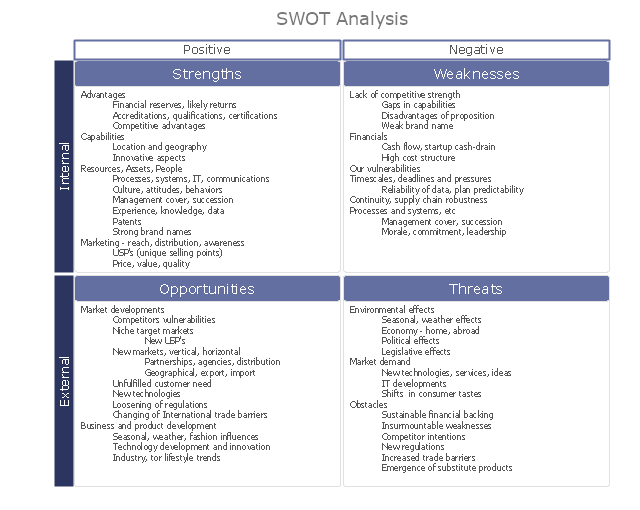
"SWOT analysis (SWOT Matrix) is a structured planning method used to evaluate the Strengths, Weaknesses, Opportunities, and Threats involved in a project or in a business venture. A SWOT analysis can be carried out for a product, place, industry or person. It involves specifying the objective of the business venture or project and identifying the internal and external factors that are favorable and unfavorable to achieving that objective. ...
The degree to which the internal environment of the firm matches with the external environment is expressed by the concept of strategic fit." [SWOT analysis. Wikipedia]
This SWOT analysis matrix diagram example was drawn using the ConceptDraw PRO diagramming and vector drawing software extended with the SWOT Analysis solution from the Management area of ConceptDraw Solution Park.
SWOT matrix
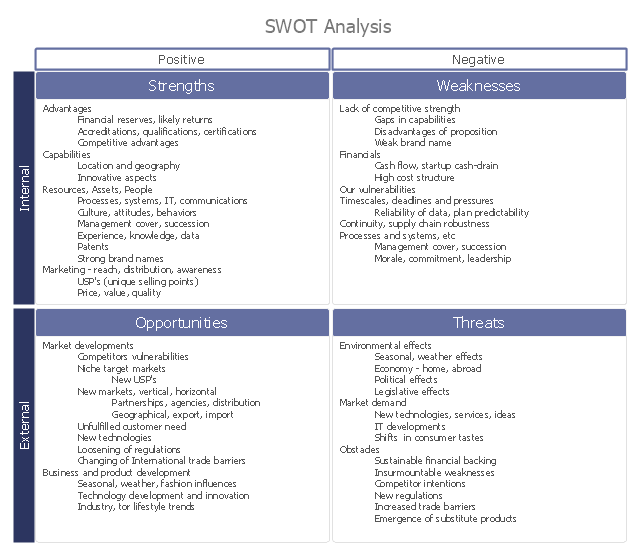
How To use Switches in Network Diagram

 Business Process Diagrams
Business Process Diagrams solution extends the ConceptDraw DIAGRAM BPM software with RapidDraw interface, templates, samples and numerous libraries based on the BPMN 1.2 and BPMN 2.0 standards, which give you the possibility to visualize equally easy simple and complex processes, to design business models, to quickly develop and document in details any business processes on the stages of project’s planning and implementation.
 Accounting Flowcharts
Accounting Flowcharts solution extends ConceptDraw DIAGRAM software with templates, samples and library of vector stencils for drawing the accounting flow charts.
 Computer Network Diagrams
Computer Network Diagrams solution extends ConceptDraw DIAGRAM software with samples, templates and libraries of vector icons and objects of computer network devices and network components to help you create professional-looking Computer Network Diagrams, to plan simple home networks and complex computer network configurations for large buildings, to represent their schemes in a comprehensible graphical view, to document computer networks configurations, to depict the interactions between network's components, the used protocols and topologies, to represent physical and logical network structures, to compare visually different topologies and to depict their combinations, to represent in details the network structure with help of schemes, to study and analyze the network configurations, to communicate effectively to engineers, stakeholders and end-users, to track network working and troubleshoot, if necessary.
 AWS Architecture Diagrams
AWS Architecture Diagrams with powerful drawing tools and numerous predesigned Amazon icons and AWS simple icons is the best for creation the AWS Architecture Diagrams, describing the use of Amazon Web Services or Amazon Cloud Services, their application for development and implementation the systems running on the AWS infrastructure. The multifarious samples give you the good understanding of AWS platform, its structure, services, resources and features, wide opportunities, advantages and benefits from their use; solution’s templates are essential and helpful when designing, description and implementing the AWS infrastructure-based systems. Use them in technical documentation, advertising and marketing materials, in specifications, presentation slides, whitepapers, datasheets, posters, etc.
 Audio and Video Connectors
Audio and video connectors solution extends ConceptDraw DIAGRAM software with templates, samples and library of vector stencils for drawing audio and video hook up diagrams.
- SWOT analysis diagram - Template
- SWOT Sample in Computers | Fishbone Diagram | Restaurant Floor ...
- Swot Analysis Examples | SWOT analysis matrix diagram templates ...
- Sentence diagram sample | Sentence diagram - Compound ...
- Pyramid Chart Examples | Pyramid Diagram | Sales Dashboard |
- SWOT Sample in Computers | Mac Tools - SWOT Analysis | SWOT ...
- SWOT analysis matrix diagram examples | Matrices | SWOT Sample ...
- SWOT Sample in Computers | SWOT analysis matrix diagram ...
- TOWS analysis matrix diagram - Template
- Swim Lane Diagrams | Cross-Functional Flowchart (Swim Lanes ...
- Crow's foot entity-relationship diagram (ERD) sample
- Flow process chart | Example Process Flow | Example of Flowchart ...
- SWOT analysis diagram - Template | SWOT Sample in Computers ...
- Timeline Diagrams | Timeline diagram template | Project timeline ...
- Network Diagram Examples | Physical LAN and WAN diagram ...
- Network Diagram Examples | 3D Network Diagram Software ...
- Matrices | Seven Management and Planning Tools | SWOT analysis ...
- Entity-Relationship Diagram (ERD) | Fishbone Diagram | AWS ...
- Network Topology | Cisco Network Topology | Network Diagram ...
- UML Sequence Diagram Example . SVG Vectored UML Diagrams ...