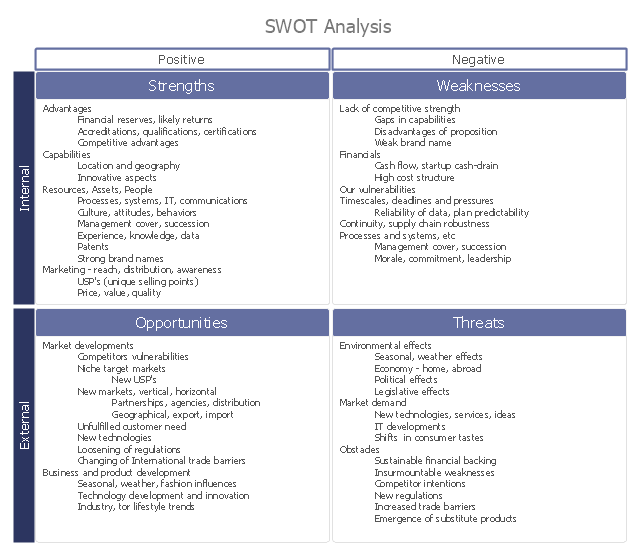
"SWOT analysis (SWOT Matrix) is a structured planning method used to evaluate the Strengths, Weaknesses, Opportunities, and Threats involved in a project or in a business venture. A SWOT analysis can be carried out for a product, place, industry or person. It involves specifying the objective of the business venture or project and identifying the internal and external factors that are favorable and unfavorable to achieving that objective. ...
The degree to which the internal environment of the firm matches with the external environment is expressed by the concept of strategic fit." [SWOT analysis. Wikipedia]
This SWOT analysis matrix diagram example was drawn using the ConceptDraw PRO diagramming and vector drawing software extended with the SWOT Analysis solution from the Management area of ConceptDraw Solution Park.
SWOT matrix
 SWOT Analysis
SWOT and TOWS Matrix Diagrams solution extends ConceptDraw PRO and ConceptDraw MINDMAP software with features, templates, samples and libraries of vector stencils for drawing SWOT and TOWS analysis matrices and mind maps.
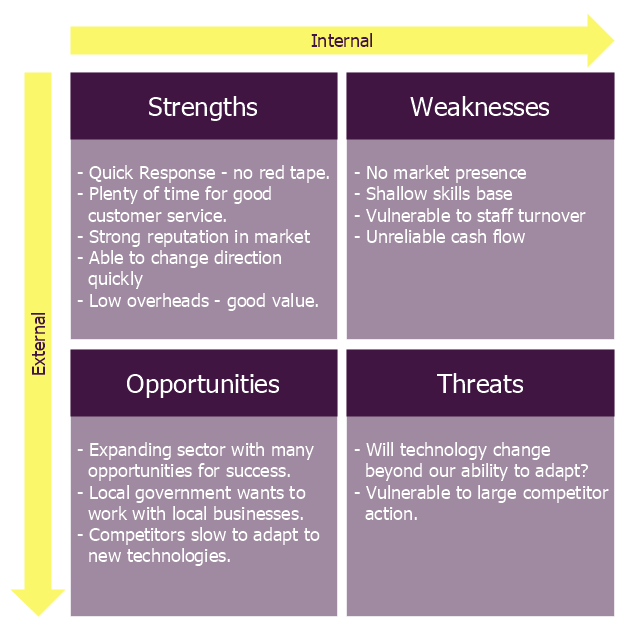
"The name says it: Strength, Weakness, Opportunity, Threat. A SWOT analysis guides you to identify the positives and negatives inside your organization (S-W) and outside of it, in the external environment (O-T). Developing a full awareness of your situation can help with both strategic planning and decision-making.
The SWOT method (which is sometimes called TOWS) was originally developed for business and industry, but it is equally useful in the work of community health and development, education, and even personal growth.
SWOT is not the only assessment technique you can use, but is one with a long track record of effectiveness. The strengths of this method are its simplicity and application to a variety of levels of operation." [ctb.ku.edu/ en/ table-of-contents/ assessment/ assessing-community-needs-and-resources/ swot-analysis/ main]
The diagram example "Small business consultancy SWOT analysis matrix" was created using the ConceptDraw PRO diagramming and vector drawing software extended with the SWOT Analysis solution from the Management area of ConceptDraw Solution Park.
SWOT matrix
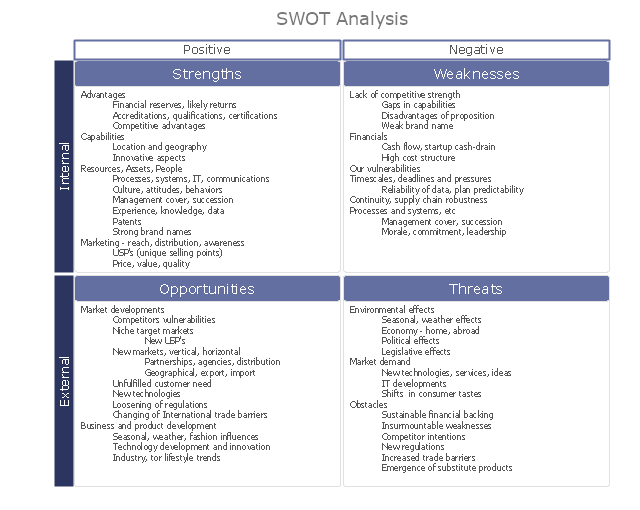
"SWOT analysis (SWOT Matrix) is a structured planning method used to evaluate the Strengths, Weaknesses, Opportunities, and Threats involved in a project or in a business venture. A SWOT analysis can be carried out for a product, place, industry or person. It involves specifying the objective of the business venture or project and identifying the internal and external factors that are favorable and unfavorable to achieving that objective. ...
The degree to which the internal environment of the firm matches with the external environment is expressed by the concept of strategic fit." [SWOT analysis. Wikipedia]
This SWOT analysis matrix diagram example was drawn using the ConceptDraw PRO diagramming and vector drawing software extended with the SWOT Analysis solution from the Management area of ConceptDraw Solution Park.
The degree to which the internal environment of the firm matches with the external environment is expressed by the concept of strategic fit." [SWOT analysis. Wikipedia]
This SWOT analysis matrix diagram example was drawn using the ConceptDraw PRO diagramming and vector drawing software extended with the SWOT Analysis solution from the Management area of ConceptDraw Solution Park.
SWOT matrix
 Fishbone Diagram
Fishbone Diagrams solution extends ConceptDraw PRO software with templates, samples and library of vector stencils for drawing the Ishikawa diagrams for cause and effect analysis.
 Entity-Relationship Diagram (ERD)
Entity-Relationship Diagram (ERD) solution extends ConceptDraw PRO software with templates, samples and libraries of vector stencils from drawing the ER-diagrams by Chen's and crow’s foot notations.
 Value Stream Mapping
Value stream mapping solution extends ConceptDraw PRO software with templates, samples and vector stencils for drawing the Value Stream Maps (VSM) in lean manufacturing practice.
 Cross-Functional Flowcharts
Cross-functional flowcharts are powerful and useful tool for visualizing and analyzing complex business processes which requires involvement of multiple people, teams or even departments. They let clearly represent a sequence of the process steps, the order of operations, relationships between processes and responsible functional units (such as departments or positions).
 Event-driven Process Chain Diagrams
Event-driven Process Chain (EPC) Diagram is a type of flowchart widely used for modeling in business engineering and reengineering, business process improvement, and analysis. EPC method was developed within the Architecture of Integrated Information Systems (ARIS) framework.
- SWOT analysis diagram - Template
- Swot Analysis Examples | SWOT Analysis | SWOT analysis matrix ...
- SWOT analysis matrix diagram templates | SWOT Sample in ...
- SWOT analysis matrix diagram examples | SWOT Analysis Tool for ...
- SWOT analysis matrix diagram examples | Matrices | SWOT Sample ...
- SWOT Analysis | SWOT analysis matrix diagram templates | SWOT ...
- SWOT Sample in Computers | SWOT analysis diagram - Template ...
- SWOT analysis matrix diagram templates | SWOT Analysis Solution ...
- TOWS analysis matrix diagram - Template | SWOT Analysis Solution ...
- SWOT analysis matrix diagram templates | What is SWOT Analysis ...
- Swot Analysis Strengths, Weaknesses, Opportunities, and Threats ...
- SWOT Analysis | SWOT Chart | SWOT analysis matrix diagram ...
- Matrices | SWOT analysis matrix diagram templates | Ansoff's ...
- SWOT analysis matrix diagram examples | SWOT Analysis Solution ...
- SWOT Sample in Computers | Swot Analysis Examples | Swot ...
- Porter's value chain matrix diagram | Swot Analysis Examples | Swot ...
- Matrices | Feature comparison chart - Digital scouting cameras ...
- Ansoff's Product/Market matrix | SWOT analysis matrix diagram ...
- SWOT analysis matrix - Template