Data Flow Diagram

Data Flow Diagram Symbols. DFD Library

Example of DFD for Online Store (Data Flow Diagram)


IDEF0 standard with ConceptDraw DIAGRAM

Cross-Functional Flowchart


Entity Relationship Diagram Examples


IDEF1X Standard

Structured Systems Analysis and Design Method (SSADM) with ConceptDraw DIAGRAM

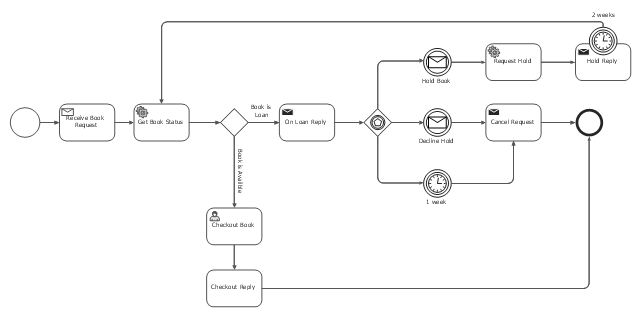
This BPMN (Business Process Model and Notation) diagram sample depicts the booking process workflow.
"The vision of BPMN 2.0 is to have one single specification for a new Business Process Model and Notation that defines the notation, metamodel and interchange format but with a modified name that still preserves the "BPMN" brand. The features include:
(1) Aligning BPMN with the business process definition meta model BPDM to form a single consistent language.
(2) Enabling the exchange of business process models and their diagram layouts among process modeling tools to preserve semantic integrity.
(3) Expand BPMN to allow model orchestrations and choreographies as stand-alone or integrated models.
(4) Support the display and interchange of different perspectives on a model that allow a user to focus on specific concerns.
(5) Serialize BPMN and provide XML schemes for model transformation and to extend BPMN towards business modeling and executive decision support." [Business Process Model and Notation. Wikipedia]
The business process modeling diagram example "Booking process - BPMN 2.0 diagram" was designed using the ConceptDraw PRO diagramming and vector drawing software extended with the Business Process Model and Notation solution from the Business Processes area of ConceptDraw Solution Park.
Business process modeling
TOWS Matrix

- BPR Diagram . Business Process Reengineering Example ...
- Transformation Of Energy Flow Diagrams Chart
- Take An Example Of Er Diagram And Show Its Transformation Into ...
- Example Of Energy Transformation Clipart
- Chemistry Drawings | Energy Transformation Clipart
- Entity-Relationship Diagram (ERD) | Simple To Compound ...
- Input Transformation Output Relationship In A Restaurant
- Flowchart Symbol For Data Transformation
- Example of DFD for Online Store (Data Flow Diagram ) DFD ...
- Rack Diagrams | Computer Network Diagrams | Example of DFD for ...