HelpDesk
How to Create a Fishbone (Ishikawa) Diagram Quickly
 Diagram Quickly")
HelpDesk
How to Draw a Fishbone Diagram

 Fishbone Diagrams
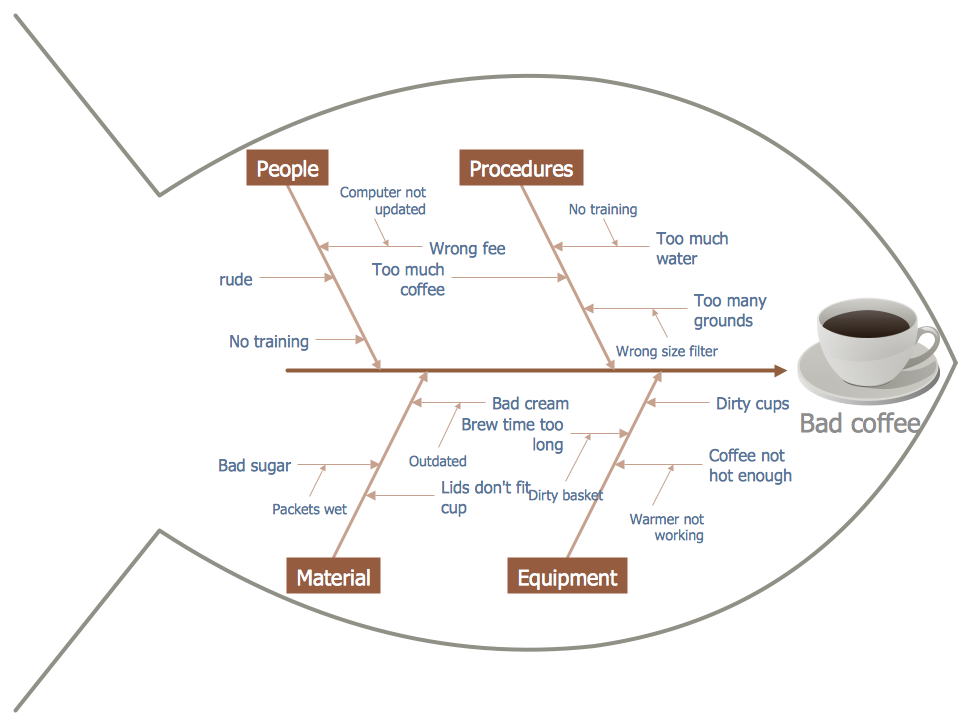
The Fishbone Diagrams solution extends ConceptDraw DIAGRAM software with the ability to easily draw the Fishbone Diagrams (Ishikawa Diagrams) to clearly see the cause and effect analysis and also problem solving. The vector graphic diagrams produced using this solution can be used in whitepapers, presentations, datasheets, posters, and published technical material.
How to Construct a Fishbone Diagram

Cause and Effect Fishbone Diagram

ERD Symbols and Meanings


Fishbone Diagram Problem Solving

Fishbone Diagram
The library of vector stencils "Fishbone diagrams" contains 13 symbols for drawing the Ishikawa diagrams using the ConceptDraw PRO diagramming and vector drawing software.
"Ishikawa diagrams were popularized by Kaoru Ishikawa in the 1960s, who pioneered quality management processes in the Kawasaki shipyards, and in the process became one of the founding fathers of modern management.
The basic concept was first used in the 1920s, and is considered one of the seven basic tools of quality control. It is known as a fishbone diagram because of its shape, similar to the side view of a fish skeleton." [Ishikawa diagram. Wikipedia]
"The Seven Basic Tools of Quality is a designation given to a fixed set of graphical techniques identified as being most helpful in troubleshooting issues related to quality. They are called basic because they are suitable for people with little formal training in statistics and because they can be used to solve the vast majority of quality-related issues.
The seven tools are:
(1) Cause-and-effect diagram (also known as the "fishbone" or Ishikawa diagram);
(2) Check sheet;
(3) Control chart;
(4) Histogram;
(5) Pareto chart;
(6) Scatter diagram;
(7) Stratification (alternately, flow chart or run chart)." [Seven Basic Tools of Quality. Wikipedia]
The example "Design elements - Fishbone diagram" is included in the Fishbone Diagrams solution from the Management area of ConceptDraw Solution Park.
Ishikawa diagram symbols

Sentence Diagrammer

- Diagram Of Bobsleigh Skeleton
- Winter Olympics - Skeleton | Winter Sports | Sport pictograms ...
- Fishbone Diagrams | Skeleton Flow Chart
- Periodic Table Skeleton Diagram
- Website Wireframe | Draw A Skeleton Diagram Of Long Form Of ...
- Human Anatomy | Fishbone Diagrams | Website Wireframe | Human ...
- How to Create a Fishbone (Ishikawa) Diagram Quickly | Flowchart ...
- Winter Sports | Fishbone Diagrams | Specific Rules Of The Sport ...
- Skeleton - Winter sports pictograms | Winter Olympics - Skeleton ...
- Using Fishbone Diagrams for Problem Solving | Flowchart Of Bones ...