Chart Maker for Presentations
Easy charting software comes with beautiful chart templates and examples. This makes it easy to create professional charts without prior experience.Column Chart Software
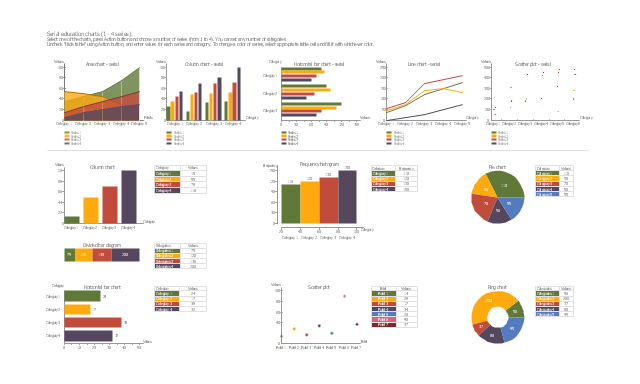
ConceptDraw Column Chart software allows drawing column charts using predesigned objects or drawing tools. In ConceptDraw Column Chart software you can find a complete set of column chart tools and objects.The vector stencils library "Education charts" contains 12 graphs and charts: area chart, column chart, divided bar diagram, histogram, horizontal bar graph, line graph, pie chart, ring chart, scatter plot.
Use it to create your educational infograms.
"A chart can take a large variety of forms, however there are common features that provide the chart with its ability to extract meaning from data.
Typically the data in a chart is represented graphically, since humans are generally able to infer meaning from pictures quicker than from text. Text is generally used only to annotate the data.
One of the more important uses of text in a graph is the title. A graph's title usually appears above the main graphic and provides a succinct description of what the data in the graph refers to.
Dimensions in the data are often displayed on axes. If a horizontal and a vertical axis are used, they are usually referred to as the x-axis and y-axis respectively. Each axis will have a scale, denoted by periodic graduations and usually accompanied by numerical or categorical indications. Each axis will typically also have a label displayed outside or beside it, briefly describing the dimension represented. If the scale is numerical, the label will often be suffixed with the unit of that scale in parentheses. ...
The data of a chart can appear in all manner of formats, and may include individual textual labels describing the datum associated with the indicated position in the chart. The data may appear as dots or shapes, connected or unconnected, and in any combination of colors and patterns. Inferences or points of interest can be overlaid directly on the graph to further aid information extraction.
When the data appearing in a chart contains multiple variables, the chart may include a legend (also known as a key). A legend contains a list of the variables appearing in the chart and an example of their appearance. This information allows the data from each variable to be identified in the chart." [Chart. Wikipedia]
The shapes example "Design elements - Education charts" was created using the ConceptDraw PRO diagramming and vector drawing software extended with the Education Infographics solition from the area "Business Infographics" in ConceptDraw Solution Park.
 Website Wireframe
The innovative Website Wireframe solution enhances the ConceptDraw DIAGRAM functionality with newest wireframe tools, libraries with variety of predesigned icons, symbols, buttons, graphics, forms, boxes, and many other vector elements, templates and professionally designed samples, which make it the best wireframing software. Website Wireframe solution gives you significant advantages when designing and maintaining websites, creating skeletal and content-free depictions of website structure, making website prototypes and planning the content arrangement before committing to design, also speeds up the processes of sketching, producing and sharing wireframe examples of website style and interface design.
Vertical Cross Functional Flowchart
ConceptDraw DIAGRAM is a powerful tool that helps you create professional looking cross-functional flowcharts with the well-designed objects. ConceptDraw DIAGRAM - Drawing Software for Vertical Cross Functional Flowchart. ConceptDraw allows you to focus on work, not the drawing process. ConceptDraw Arrows10 Technology allows to draw connectors with smart behavior that gives flexibility to you during work process.HelpDesk
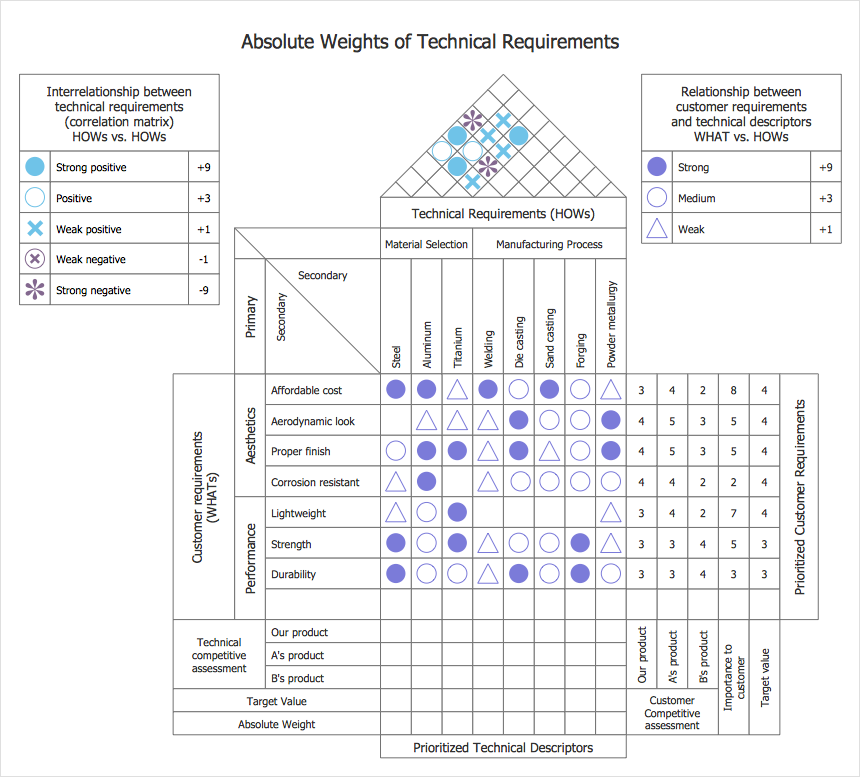
How to Create a House of Quality Diagram
The House of Quality diagram is a part of quality function deployment method (QFD) designed by Japanese planning specialists to help turn customer requirements (voice of the customer) into technical features of a final product. The House of Quality solution for ConceptDraw DIAGRAM is a tool for designing HOQ diagrams. There are 2 libraries containing 54 vector stencils you can use to create House of Quality diagrams of any type.Process Flow Diagram
A Process Flow Diagram (PFD) is a diagram which shows the relationships between the main components in a system. Process Flow Diagrams are widely used by engineers in chemical and process engineering, they allows to indicate the general flow of plant process streams and equipment, helps to design the petroleum refineries, petrochemical and chemical plants, natural gas processing plants, and many other industrial facilities. ConceptDraw DIAGRAM diagramming and vector drawing software extended with powerful tools of Flowcharts Solution from the "Diagrams" Area of ConceptDraw Solution Park is effective for drawing: Process Flow Diagram, Flow Process Diagram, Business Process Flow Diagrams.How to Create a Process Flowchart
Use ConceptDraw DIAGRAM diagramming and vector graphics software to visually model your own IT construction processes.Radar Chart
This sample shows the Radar Chart that compares the internet dimensions in the four countries. The Radar Chart represents the multivariate data as a two-dimensional chart with three or more variables displayed on the axes that start in one point. The Radar Charts are used in the quality management, business, analytics and sport.Entity Relationship Diagram Software for Mac
Great part of modern approaches to the database design are based on the use of different versions of ER-models. The important feature of entity-relationship model is that it can be visually represented as a graphical diagram. ER-models and Entity Relationship Diagrams are so popular due to the simplicity and the presentation clarity. The conceptual basis led to their widespread use in CASE-systems, which support automatic design of relational databases. The typical concepts for ER-models are entity, relation and attribute. Relation is a graphically represented association between two entities, that establishes certain rules and all instances of the linked entity types are subject to these rules. In common ER-model this association is always binary. For representing entity-relationship elements, there are used Crow’s foot and Chen notations. ConceptDraw DIAGRAM is a famous Entity Relationship Diagram software for Mac OSX which gives the ability to describe visually the databases with Chen’s and Crow’s Foot notation icons from Entity-Relationship Diagram (ERD) solution.- Circuit Diagram Of Distillation Column In Piping
- Piping And Instrumentation Diagram For Distillation Column
- Process Instrument Diagram Of Distillation Column
- Double bar graph - Template | Design elements - Composition ...
- Process Flow Diagram | Healthy Diet Plan | Vessels - Vector stencils ...
- Column Chart Software
- Process Flow Diagram Symbols | Laboratory equipment - Vector ...
- Distillation Column Flow Chart
- Restaurant Floor Plans Samples | Column Chart Template | Chart ...
- Dashboard Design Templates Columns And Pie


