Basic Flowchart Symbols and Meaning


HelpDesk
How to Draw a Circular Arrows Diagram Using ConceptDraw PRO

Business Process Workflow Diagram


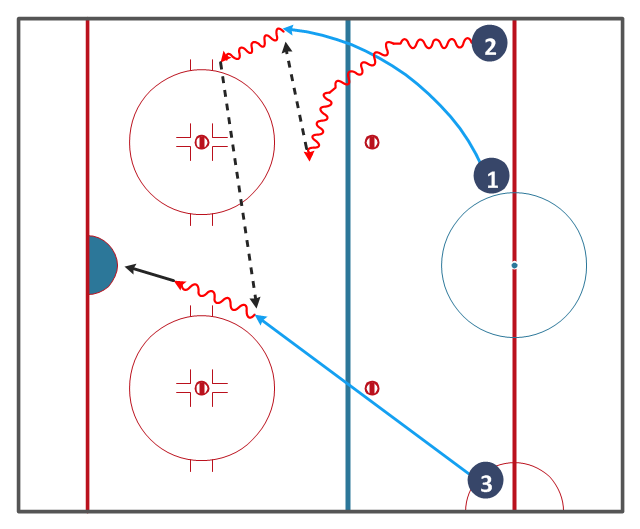
"The blue lines divide the rink into three zones. The central zone is called the neutral zone or simply centre ice. The generic term for the outer zones is end zones, but they are more commonly referred to by terms relative to each team. The end zone in which a team is trying to score is called the attacking zone or offensive zone; the end zone in which the team's own goal net is located is called the defending zone or defensive zone.
The blue line is considered part of whichever zone the puck is in. Therefore, if the puck is in the neutral zone, the blue line is part of the neutral zone. It must completely cross the blue line to be considered in the end zone. Once the puck is in the end zone, the blue line becomes part of that end zone. The puck must now completely cross the blue line in the other direction to be considered in the neutral zone again." [Ice hockey rink. Wikipedia]
The hockey drill diagram example "Entering offensive zone" was created using the ConceptDraw PRO diagramming and vector drawing software extended with the Hockey solution from the Sport area of ConceptDraw Solution Park.
Hockey drill diagram
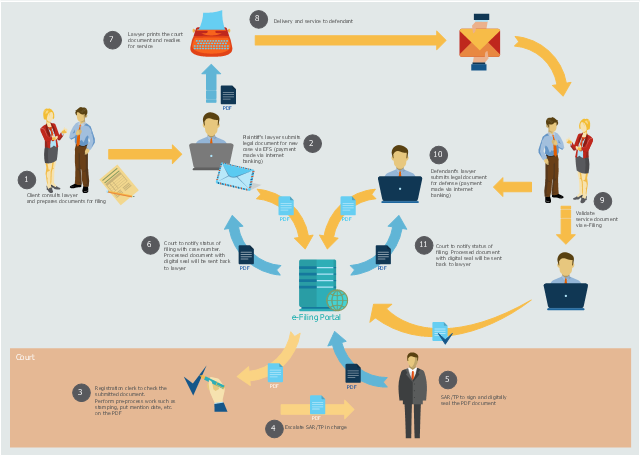
This workflow diagram example was created on the base of picture "Online submission" from the e-Filing Portal of the Malaysian Judiciary. [efiling.kehakiman.gov.my/ eFiling/ img/ efiling_ general_ workflow.jpg]
"The e-Filing Portal is an initiative of the Malaysian Judiciary and has been designed to serve as a one-stop portal for the legal community to gain access to all its needs ranging from registration of cases, filing of case documents, retrieval of service document right down to searching of case files and information including case schedules.
Previously lawyers have to call the registrar for the status of their case filing. Now the e-Filing portal will send notification of any case filing status to the lawyers' email immediately upon successful registration in the e-Filing System." [efiling.kehakiman.gov.my/ eFiling]
The flowchart example "E-Filing general workflow" was created using the ConceptDraw PRO diagramming and vector drawing software extended with the Sales Flowcharts solution from the Marketing area of ConceptDraw Solution Park.
Workflow diagram
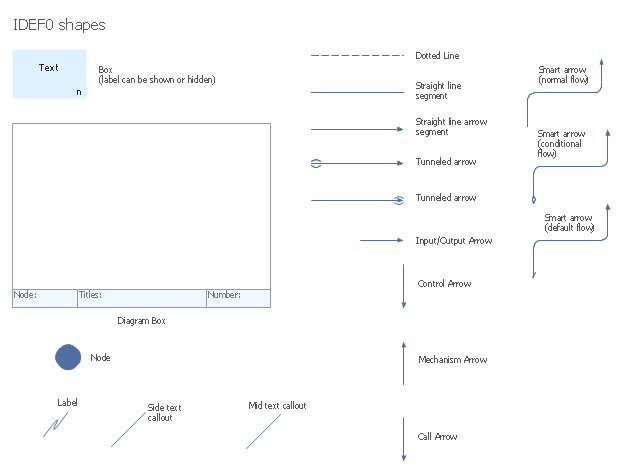
The vector stencils library "IDEF0 diagrams" contains 18 symbols for drawing IDEF0 function modeling diagrams using the ConceptDraw PRO diagramming and vector drawing software.
"The IDEF0 model ... is based on a simple syntax. Each activity is described by a verb-based label placed in a box. Inputs are shown as arrows entering the left side of the activity box while output are shown as exiting arrows on the right side of the box. Controls are displayed as arrows entering the top of the box and mechanisms are displayed as arrows entering from the bottom of the box. Inputs, Controls, Outputs, and Mechanisms are all referred to as concepts.
- Arrow : A directed line, composed of one or more arrow segments, that models an open channel or conduit conveying data or objects from source (no arrowhead) to use (with arrowhead). There are 4 arrow classes: Input Arrow, Output Arrow, Control Arrow, and Mechanism Arrow (includes Call Arrow). See Arrow Segment, Boundary Arrow, Internal Arrow.
- Box : A rectangle, containing a name and number, used to represent a function.
- Context : The immediate environment in which a function (or set of functions on a diagram) operates.
- Decomposition : The partitioning of a modeled function into its component functions.
- Fork : The junction at which an IDEF0 arrow segment (going from source to use) divides into two or more arrow segments. May denote unbundling of meaning.
- Function : An activity, process, or transformation (modeled by an IDEF0 box) identified by a verb or verb phrase that describes what must be accomplished.
- Join : The junction at which an IDEF0 arrow segment (going from source to use) merges with one or more other arrow segments to form a single arrow segment. May denote bundling of arrow segment meanings.
- Node : A box from which child boxes originate; a parent box. See Node Index, Node Tree, Node Number, Node Reference, Diagram Node Number." [IDEF0. Wikipedia]
The example "Design elements - IDEF0 diagram" is included in the IDEF0 Diagrams solution from the Software Development area of ConceptDraw Solution Park.
IDEF0 symbols
Process Flowchart


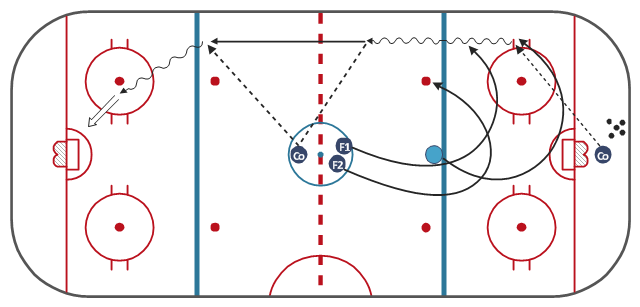
"A penalty in ice hockey is a punishment for an infringement of the rules. Most penalties are enforced by detaining the offending player within a penalty box for a set number of minutes, during which the player can not participate in play. Penalties are called and enforced by the referee, or in some cases the linesmen. The offending team usually may not replace the player on the ice, leaving them short handed as opposed to full strength. The opposing team is said to be on a power play, having one player more on the ice than the short-handed team. The short handed team is said to be "penalty killing" until the penalty expires and the penalized player returns to play. While standards vary somewhat between leagues, most leagues recognize several common degrees of penalty, as well as common infractions." [Penalty (ice hockey). Wikipedia]
The ice hockey diagram example "Penalty kill forecheck angling drill" was created using the ConceptDraw PRO diagramming and vector drawing software extended with the Hockey solution from the Sport area of ConceptDraw Solution Park.
The ice hockey diagram example "Penalty kill forecheck angling drill" was created using the ConceptDraw PRO diagramming and vector drawing software extended with the Hockey solution from the Sport area of ConceptDraw Solution Park.
Ice hockey diagram example
Fishbone Diagram Procedure

HelpDesk
How to Diagram Sentences in ConceptDraw PRO

Circular Arrows

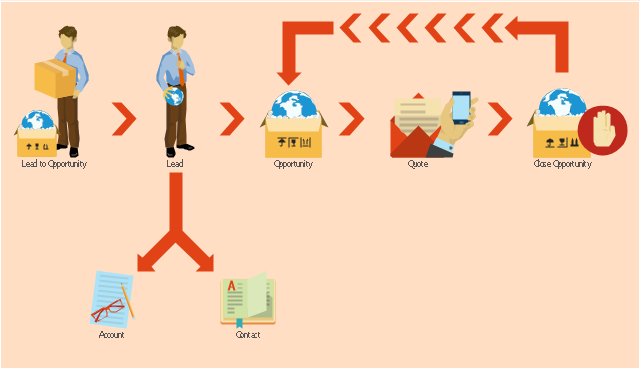
This example shows the Microsoft Dynamics CRM workflow from lead to opportunity. It was redesigned from the Wikimedia Commons file: Lead to Opportunity sales flow.svg. [commons.wikimedia.org/ wiki/ File:Lead_ to_ Opportunity_ sales_ flow.svg]
"Does your lead have what you're looking for - and vice versa? Once you've identified the timeframe, budget, purchase process, and decision makers for the sale, it's time to qualify your lead. Qualifying a lead in Microsoft Dynamics CRM converts it to an opportunity.
Ideally, your leads or prospects should have a need that you can provide a solution for, and have the budget and influence necessary for making the purchasing decision. In addition, you should be able to provide their solution within the timeframe they need it." [microsoft.com/ en-us/ dynamics/ crm-customer-center/ qualify-a-lead-and-convert-it-to-an-opportunity.aspx]
The example "Workflow - Lead to Opportunity" was created using the ConceptDraw PRO diagramming and vector drawing software extended with the Sales Flowcharts solution from the Marketing area of ConceptDraw Solution Park.
Sales workflow diagram
How to Build a Flowchart

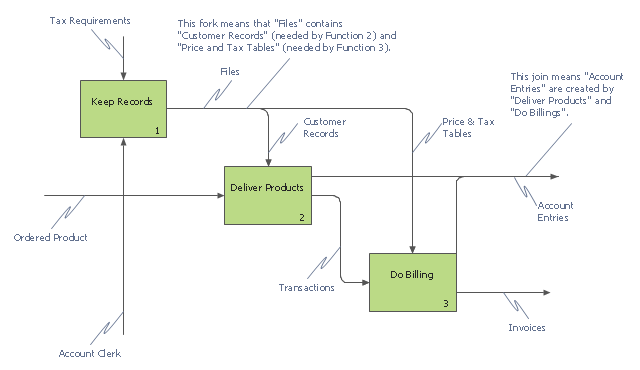
This IDEF0 diagram example was redesigned from the Wikimedia Commons file: 12 Connections Between Boxes.svg.
[commons.wikimedia.org/ wiki/ File:12_ Connections_ Between_ Boxes.svg]
"Graphical notation.
IDEF0 is a model that consists of a hierarchical series of diagrams, text, and glossary cross referenced to each other. The two primary modeling components are:
- functions (represented on a diagram by boxes), and
- data and objects that interrelate those functions (represented by arrows).
.... the position at which the arrow attaches to a box conveys the specific role of the interface. The controls enter the top of the box. The inputs, the data or objects acted upon by the operation, enter the box from the left. The outputs of the operation leave the right-hand side of the box. Mechanism arrows that provide supporting means for performing the function join (point up to) the bottom of the box." [IDEF0. Wikipedia]
The example "IDEF0 diagram - Inter-box connections" was created using the ConceptDraw PRO diagramming and vector drawing software extended with the solution "IDEF Business Process Diagrams" from the area "Business Processes" of ConceptDraw Solution Park.
IDEF0 business process diagram
- Circular Arrows Diagrams | Circular diagrams - Vector stencils ...
- How to Draw a Circular Arrows Diagram Using ConceptDraw PRO ...
- How to create an IDEF3 diagram using ConceptDraw PRO | Sales ...
- HR arrows - Vector stencils library | Circular diagrams - Vector ...
- Circular diagrams - Vector stencils library | Collaboration life-cycle ...
- How to Draw a Circular Arrows Diagram Using ConceptDraw PRO ...
- Arrows - Vector clipart library | Concept Maps | E-Filing general ...
- Innovation life cycle - Arrow loop diagram | National Preparedness ...
- Circular Arrows | Circular Arrow | Circular arrows diagrams - Vector ...
- Basic Flowchart Symbols and Meaning | Circular Arrow ...
- Draw An Arrow From Left To Right To Illustrate
- Business feedback loop | Innovation life cycle - Arrow loop diagram ...
- Circular diagrams - Vector stencils library | Fire and emergency ...
- Circular Arrows Diagrams
- Arrow Circle Clipart
- Baseball positions - Vector stencils library | Baseball Diagram ...
- Circular arrows diagram - PDCA cycle
- Circular arrows diagrams - Vector stencils library | Glyph icons ...
- Arrow circle diagram
- What Does The Right Wing Do In Hockey