 Fishbone Diagram
Fishbone Diagrams solution extends ConceptDraw PRO software with templates, samples and library of vector stencils for drawing the Ishikawa diagrams for cause and effect analysis.
This work flow chart sample was redesigned from the picture "Weather Forecast" from the article "Simulation Workflows".
[iaas.uni-stuttgart.de/ forschung/ projects/ simtech/ sim-workflows.php]
"(1) The weather is predicted for a particular geological area. Hence, the workflow is fed with a model of the geophysical environment of ground, air and water for a requested area.
(2) Over a specified period of time (e.g. 6 hours) several different variables are measured and observed. Ground stations, ships, airplanes, weather balloons, satellites and buoys measure the air pressure, air/ water temperature, wind velocity, air humidity, vertical temperature profiles, cloud velocity, rain fall, and more.
(3) This data needs to be collected from the different sources and stored for later access.
(4) The collected data is analyzed and transformed into a common format (e.g. Fahrenheit to Celsius scale). The normalized values are used to create the current state of the atmosphere.
(5) Then, a numerical weather forecast is made based on mathematical-physical models (e.g. GFS - Global Forecast System, UKMO - United Kingdom MOdel, GME - global model of Deutscher Wetterdienst). The environmental area needs to be discretized beforehand using grid cells. The physical parameters measured in Step 2 are exposed in 3D space as timely function. This leads to a system of partial differential equations reflecting the physical relations that is solved numerically.
(6) The results of the numerical models are complemented with a statistical interpretation (e.g. with MOS - Model-Output-Statistics). That means the forecast result of the numerical models is compared to statistical weather data. Known forecast failures are corrected.
(7) The numerical post-processing is done with DMO (Direct Model Output): the numerical results are interpolated for specific geological locations.
(8) Additionally, a statistical post-processing step removes failures of measuring devices (e.g. using KALMAN filters).
(9) The statistical interpretation and the numerical results are then observed and interpreted by meteorologists based on their subjective experiences.
(10) Finally, the weather forecast is visualized and presented to interested people." [iaas.uni-stuttgart.de/ forschung/ projects/ simtech/ sim-workflows.php]
The example "Workflow diagram - Weather forecast" was drawn using the ConceptDraw PRO diagramming and vector drawing software extended with the Workflow Diagrams solution from the Business Processes area of ConceptDraw Solution Park.
Work flow chart

 HVAC Plans
Use HVAC Plans solution to create professional, clear and vivid HVAC-systems design plans, which represent effectively your HVAC marketing plan ideas, develop plans for modern ventilation units, central air heaters, to display the refrigeration systems for automated buildings control, environmental control, and energy systems.
 Computer and Networks Area
The solutions from Computer and Networks Area of ConceptDraw Solution Park collect samples, templates and vector stencils libraries for drawing computer and network diagrams, schemes and technical drawings.
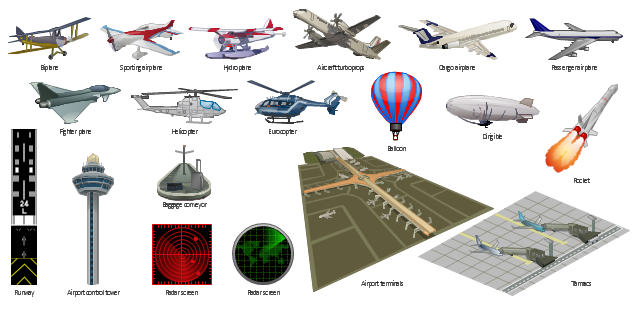
The vector clipart library Aircraft contains 19 images of aerial vehicles and aviation objects. Use the vector stencils library Aircraft to draw aviation illustrations, presentation slides, infographics and diagrams using the ConceptDraw PRO diagramming and vector drawing software. "Civil aviation is one of two major categories of flying, representing all non-military aviation, both private and commercial. Most of the countries in the world are members of the International Civil Aviation Organization (ICAO) and work together to establish common standards and recommended practices for civil aviation through that agency. Civil aviation includes two major categories: - Scheduled air transport, including all passenger and cargo flights operating on regularly scheduled routes; and - General aviation (GA), including all other civil flights, private or commercial. ... Some countries also make a regulatory distinction based on whether aircraft are flown for hire like: - Commercial aviation includes most or all flying done for hire, particularly scheduled service on airlines; and - Private aviation includes pilots flying for their own purposes (recreation, business meetings, etc.) without receiving any kind of remuneration. All scheduled air transport is commercial, but general aviation can be either commercial or private. Normally, the pilot, aircraft, and operator must all be authorized to perform commercial operations through separate commercial licensing, registration, and operation certificates." [Civil aviation. Wikipedia] The design elements library Aircraft is included in the Aerospace and Transport solution from the Illustration area of ConceptDraw Solution Park.
Vector clip art
 Metro Map
Metro Map solution extends ConceptDraw PRO software with templates, samples and library of vector stencils for drawing the metro maps, route maps, bus and other transport schemes, or design tube-style infographics.
 Pie Charts
Pie Charts are extensively used in statistics and business for explaining data and work results, in mass media for comparison (i.e. to visualize the percentage for the parts of one total), and in many other fields. The Pie Charts solution for ConceptDraw PRO v10 offers powerful drawing tools, varied templates, samples, and a library of vector stencils for simple construction and design of Pie Charts, Donut Chart, and Pie Graph Worksheets.
 Illustration Area
Solutions from the Illustrations Area of ConceptDraw Solution Park collect templates, samples and libraries of color scalable vector stencils, icons and clip art for illustrating documents, presentations, infographics, web sites and blogs.
 Correlation Dashboard
Correlation dashboard solution extends ConceptDraw PRO software with samples, templates and vector stencils library with Scatter Plot Charts for drawing the visual dashboard visualizing data correlation.
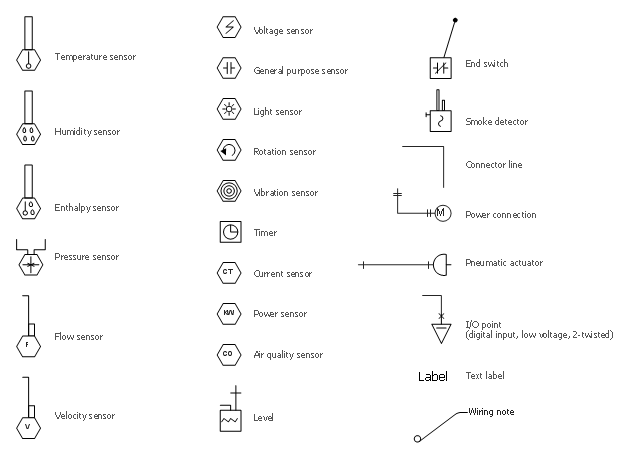
The vector stencils library "HVAC controls" contains 23 symbols of HVAC controls (sensors, actuators, timers, controllers, I/ O points).
"HVAC (... Heating, Ventilation and Air Conditioning) is a control system that applies regulation to a heating and/ or air conditioning system. ...
Central controllers and most terminal unit controllers are programmable, meaning the direct digital control program code may be customized for the intended use. The program features include time schedules, setpoints, controllers, logic, timers, trend logs, and alarms. The unit controllers typically have analog and digital inputs that allow measurement of the variable (temperature, humidity, or pressure) and analog and digital outputs for control of the transport medium (hot/ cold water and/ or steam). Digital inputs are typically (dry) contacts from a control device, and analog inputs are typically a voltage or current measurement from a variable (temperature, humidity, velocity, or pressure) sensing device. Digital outputs are typically relay contacts used to start and stop equipment, and analog outputs are typically voltage or current signals to control the movement of the medium (air/ water/ steam) control devices such as valves, dampers, and motors." [HVAC control system. Wikipedia]
Use the design elements library "HVAC controls" for drawing the HVAC system diagrams, controls drawings, and automated building control and environmental control system layuout floor plans using the ConceptDraw PRO diagramming and vector drawing software.
The shapes library "HVAC controls" is included in the HVAC Plans solution from the Building Plans area of ConceptDraw Solution Park.
HVAC control symbols
- Diagrams Of Means Of Air Transport
- Air Transport Diagram
- Fishbone Diagram | Design elements - Aircraft | Transport ...
- Example Of Air Transport
- Examples Of Air Transport
- Exsmples Of Air Transport
- Diagrams Of Air Means Of Transportation
- Air Transportation Examples
- Piping and Instrumentation Diagram Software | Examples Of Air ...
- Draw The Two Example Of Air Transportation
- What Is Air Transportation With Diagram
- Piping and Instrumentation Diagram Software | Types Of Air ...
- Examples Of Air Transport Pictures Easy To Draw
- Diagram Of A Rail Transport And Air Transport
- How To Make Project On Air Transport In Chart
- Air Transport
- Examples Of Transportation By Air
- Fishbone Diagram | Five Examples Of Airtransport
- Fishbone Diagram | Fishbone Diagrams | Aerospace and Transport ...
- Road Transport - Design Elements | UML Class Diagram Example ...