 Human Anatomy
Human Anatomy solution extends ConceptDraw DIAGRAM functionality with best tools to design diagrams and illustrations for using in a sphere of medicine and health care, infographics on the human physiology and anatomy thematic, to represent the structure of male and female bodies from the front and back views, description in details any of physiological systems of the human organism, such as central and peripheral nervous systems, respiratory system, cardiovascular system, digestive system, endocrine system, reproductive system, urinary system, skeletal system, muscular system, integumentary system, lymphatic system, sensory system, visual system, immune system.
Fishbone Diagram Problem Solving

ERD Symbols and Meanings


This human anatomy illustration sample was designed on the base of Wikimedia Commons file: Organ Systems I.jpg [en.wikipedia.org/ wiki/ File:Organ_ Systems_ I.jpg].
This file is licensed under the Creative Commons Attribution 3.0 Unported license. [creativecommons.org/ licenses/ by/ 3.0/ deed.en]
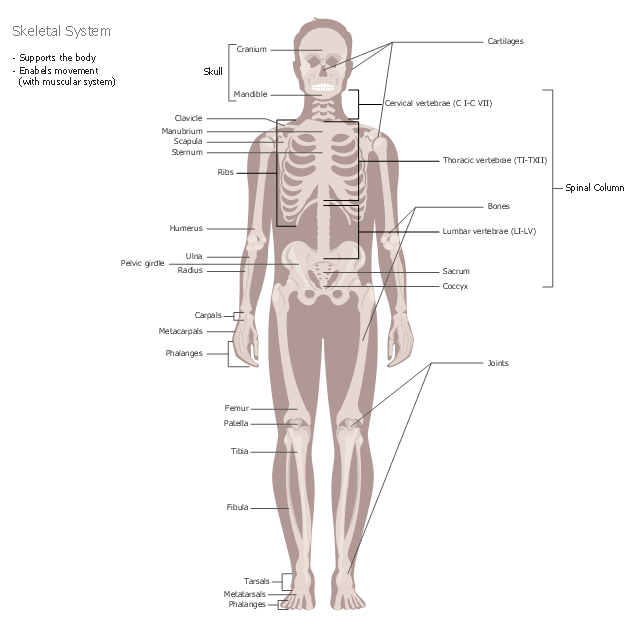
"Skeletal system: structural support and protection with bones, cartilage, ligaments and tendons." [Biological system. Wikipedia]
"The human skeleton is the internal framework of the body. It is composed of around 270 bones at birth – this total decreases to around 206 bones by adulthood after some bones have fused together. ... The human skeleton can be divided into the axial skeleton and the appendicular skeleton. The axial skeleton is formed by the vertebral column, the rib cage, the skull and other associated bones. The appendicular skeleton, which is attached to the axial skeleton, is formed by the shoulder girdle, the pelvic girdle and the bones of the upper and lower limbs.
The human skeleton performs six major functions; support, movement, protection, production of blood cells, storage of minerals, and endocrine regulation." [Human skeleton. Wikipedia]
The human anatomy illustration example "Skeletal system" was created using ConceptDraw PRO software extended with Human Anatomy solution from Health area of ConceptDraw Solution Park.
This file is licensed under the Creative Commons Attribution 3.0 Unported license. [creativecommons.org/ licenses/ by/ 3.0/ deed.en]
"Skeletal system: structural support and protection with bones, cartilage, ligaments and tendons." [Biological system. Wikipedia]
"The human skeleton is the internal framework of the body. It is composed of around 270 bones at birth – this total decreases to around 206 bones by adulthood after some bones have fused together. ... The human skeleton can be divided into the axial skeleton and the appendicular skeleton. The axial skeleton is formed by the vertebral column, the rib cage, the skull and other associated bones. The appendicular skeleton, which is attached to the axial skeleton, is formed by the shoulder girdle, the pelvic girdle and the bones of the upper and lower limbs.
The human skeleton performs six major functions; support, movement, protection, production of blood cells, storage of minerals, and endocrine regulation." [Human skeleton. Wikipedia]
The human anatomy illustration example "Skeletal system" was created using ConceptDraw PRO software extended with Human Anatomy solution from Health area of ConceptDraw Solution Park.
Healthcare illustration
 Fishbone Diagrams
The Fishbone Diagrams solution extends ConceptDraw DIAGRAM software with the ability to easily draw the Fishbone Diagrams (Ishikawa Diagrams) to clearly see the cause and effect analysis and also problem solving. The vector graphic diagrams produced using this solution can be used in whitepapers, presentations, datasheets, posters, and published technical material.
Draw Fishbone Diagram on MAC Software

Total Quality Management Business Diagram

Data Flow Diagram Software

 Website Wireframe
The innovative Website Wireframe solution enhances the ConceptDraw DIAGRAM functionality with newest wireframe tools, libraries with variety of predesigned icons, symbols, buttons, graphics, forms, boxes, and many other vector elements, templates and professionally designed samples, which make it the best wireframing software. Website Wireframe solution gives you significant advantages when designing and maintaining websites, creating skeletal and content-free depictions of website structure, making website prototypes and planning the content arrangement before committing to design, also speeds up the processes of sketching, producing and sharing wireframe examples of website style and interface design.
- Human Skeletal System Flow Chart
- Diagram Of Skeletal System
- Human Anatomy | Entity Relationship Diagram - ERD - Software for ...
- Fishbone Diagrams | Skeleton Flow Chart
- Diagram That Allows You To Label The Skeletal System
- Human Anatomy | Urinary system | Male Urinary System Diagram
- Flow Chart Of Human Bones
- New Human Anatomy Solution Added to ConceptDraw Solution Park
- Human Anatomy | Digestive System In Flow Chart
- Human Anatomy | Endocrine System Flow Diagram