This IDEF0 diagram example was redesigned from the Wikimedia Commons file: 12 Connections Between Boxes.svg.
[commons.wikimedia.org/ wiki/ File:12_ Connections_ Between_ Boxes.svg]
"Graphical notation.
IDEF0 is a model that consists of a hierarchical series of diagrams, text, and glossary cross referenced to each other. The two primary modeling components are:
- functions (represented on a diagram by boxes), and
- data and objects that interrelate those functions (represented by arrows).
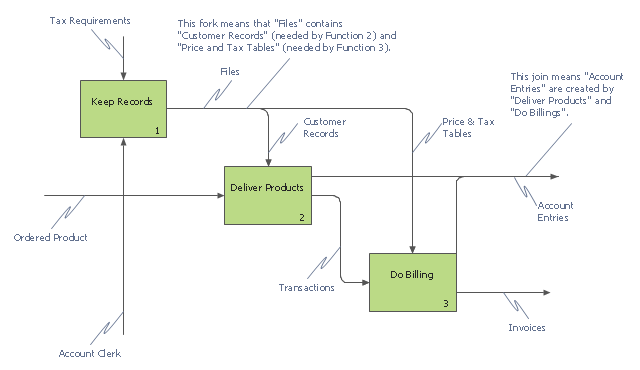
.... the position at which the arrow attaches to a box conveys the specific role of the interface. The controls enter the top of the box. The inputs, the data or objects acted upon by the operation, enter the box from the left. The outputs of the operation leave the right-hand side of the box. Mechanism arrows that provide supporting means for performing the function join (point up to) the bottom of the box." [IDEF0. Wikipedia]
The example "IDEF0 diagram - Inter-box connections" was created using the ConceptDraw PRO diagramming and vector drawing software extended with the solution "IDEF Business Process Diagrams" from the area "Business Processes" of ConceptDraw Solution Park.
[commons.wikimedia.org/ wiki/ File:12_ Connections_ Between_ Boxes.svg]
"Graphical notation.
IDEF0 is a model that consists of a hierarchical series of diagrams, text, and glossary cross referenced to each other. The two primary modeling components are:
- functions (represented on a diagram by boxes), and
- data and objects that interrelate those functions (represented by arrows).
.... the position at which the arrow attaches to a box conveys the specific role of the interface. The controls enter the top of the box. The inputs, the data or objects acted upon by the operation, enter the box from the left. The outputs of the operation leave the right-hand side of the box. Mechanism arrows that provide supporting means for performing the function join (point up to) the bottom of the box." [IDEF0. Wikipedia]
The example "IDEF0 diagram - Inter-box connections" was created using the ConceptDraw PRO diagramming and vector drawing software extended with the solution "IDEF Business Process Diagrams" from the area "Business Processes" of ConceptDraw Solution Park.
IDEF0 business process diagram
 IDEF Business Process Diagrams
Use the IDEF Business Process Diagrams solution to create effective database designs and object-oriented designs, following the integration definition methodology.
HelpDesk
How to Create an IDEF0 Diagram

How to Draw a Good Diagram of a Business Workflow?

Diagramming software for Amazon Web Service diagrams, charts and schemes
ConceptDraw Arrows10 Technology

ERD Symbols and Meanings


HelpDesk
How to Create an IDEF3 Diagram


- IDEF0 diagram - Inter- box connections | Design elements - IDEF0 ...
- Basic Flowchart Symbols and Meaning | Flowchart design ...
- IDEF0 diagram - Inter- box connections | Top-level context diagram ...
- Eisenhower box | IDEF0 diagram - Inter- box connections | Mac OS X ...
- IDEF0 diagram - Inter- box connections | IDEF Business Process ...
- Bio Flowchart Lite | Input Box Of A Flow Chart Is Used To
- Basic Flowchart Symbols and Meaning | Flow Chart Symbols ...
- VoIP call with SIM box and gateway | IDEF0 diagram - Inter- box ...
- Flow Chart Symbols | Basic Flowchart Symbols and Meaning | How ...
- How to Draw a Circular Arrows Diagram Using ConceptDraw PRO ...
- IDEF0 diagram - Inter- box connections
- GUI Prototyping with ConceptDraw PRO | Befine Type Box Use In Floq
- How to Create a Timeline Diagram in ConceptDraw PRO | How to ...
- ConceptDraw Arrows10 Technology | How to Connect Objects on ...
- Curved Line With Two Sides Arrow
- IDEF0 Software | How to Create an IDEF0 Diagram for an ...
- Create Flow Chart on Mac | Business Process Modeling Software for ...
- Workflow Diagram Template | Scrum workflow | Workflow Diagram ...
- Examples of Flowcharts, Org Charts and More | Flowchart ...
- Types of Flowcharts | Basic Flowchart Symbols and Meaning | Flow ...