Business Process Flow Diagram

Data Modeling Diagram

Entity-Relationship Diagram

Cross Functional Diagram

 Event-driven Process Chain Diagrams
Event-Driven Process Chain Diagrams solution extends ConceptDraw DIAGRAM functionality with event driven process chain templates, samples of EPC engineering and modeling the business processes, and a vector shape library for drawing the EPC diagrams and EPC flowcharts of any complexity. It is one of EPC IT solutions that assist the marketing experts, business specialists, engineers, educators and researchers in resources planning and improving the business processes using the EPC flowchart or EPC diagram. Use the EPC solutions tools to construct the chain of events and functions, to illustrate the structure of a business process control flow, to describe people and tasks for execution the business processes, to identify the inefficient businesses processes and measures required to make them efficient.
What Is a Circle Spoke Diagram

Fishbone Diagram Problem Solving

Pyramid Diagram and Pyramid Chart

Total Quality Management Value

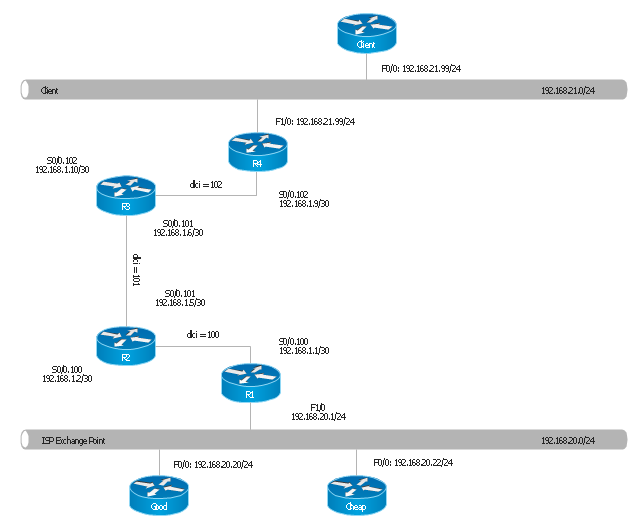
"Logical topology, or signal topology, is the arrangement of devices on a computer network and how they communicate with one another. How devices are connected to the network through the actual cables that transmit data, or the physical structure of the network, is called the physical topology. Physical topology defines how the systems are physically connected. It represents the physical layout of the devices on the network. The logical topology defines how the systems communicate across the physical topologies.
Logical topologies are bound to network protocols and describe how data is moved across the network. ...
EXAMPLE : twisted pair Ethernet is a logical bus topology in a physical star topology layout. while IBM's token ring is a logical ring topology, it is physically set up in star topology." [Logical topology. Wikipedia]
This Cisco logical computer network diagram example was created using the ConceptDraw PRO diagramming and vector drawing software extended with the Cisco Network Diagrams solution from the Computer and Networks area of ConceptDraw Solution Park.
Logical network topology diagram
- Marketing plan - Circular diagram | Marketing Analysis Diagram ...
- Diagram Physical Topologies | Physical LAN topology diagram ...
- Package Diagram For E Book Management
- UML class diagram - Metadata information model | Data Flow ...
- Design elements - ERD (crow's foot notation) | Crows Foot Adalah
- Pyramid Diagram | Purchase funnel diagram | 5-level funnel ...
- Spoke Diagram
- Chen Notation | Design elements - ER diagram (Chen notation ...
- 4 Level pyramid model diagram - Information systems types ...