This site uses cookies. By continuing to browse the ConceptDraw site you are agreeing to our Use of Site Cookies.

Data Flow Diagrams

ConceptDraw DIAGRAM software enables you to quickly create data flow diagrams that include data storage, external entities, functional transforms, data flows, and control transforms and signals.

Example of DFD for Online Store (Data Flow Diagram) DFD Example
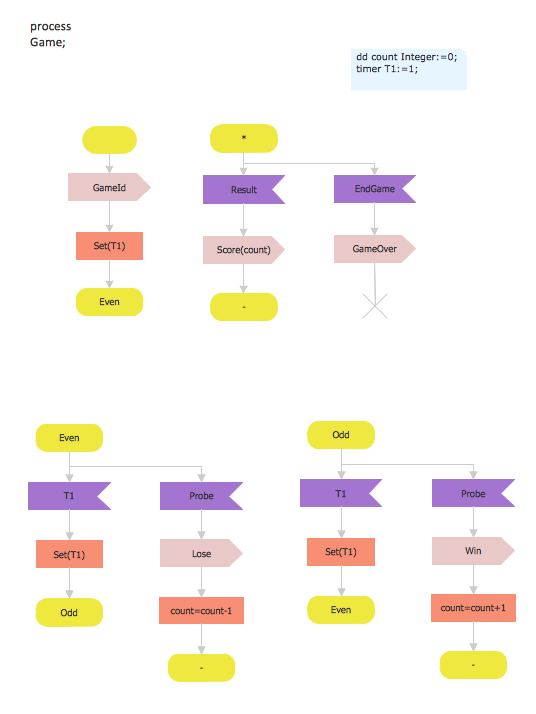
Data flow diagrams (DFDs) reveal relationships among and between the various components in a program or system. DFDs are an important technique for modeling a system’s high-level detail by showing how input data is transformed to output results through a sequence of functional transformations.
Example of DFD for Online Store shows the Data Flow Diagram for online store and interactions between the Visitors, Customers and Sellers, as well as Website Information and User databases.
Steps to Creating a Sales Process Flow Chart

SDL Diagram

Specification and Description Language (SDL) is used for creating the object-oriented diagrams, visualizing the processes of the state machines for the systems of communication, telecommunication, automotive, aviation and medical industries. SDL is a specification language for creating specifications, descriptions of the behavior, data, and inheritance for real-time systems.
This sample shows the SDL Diagram of the process game.

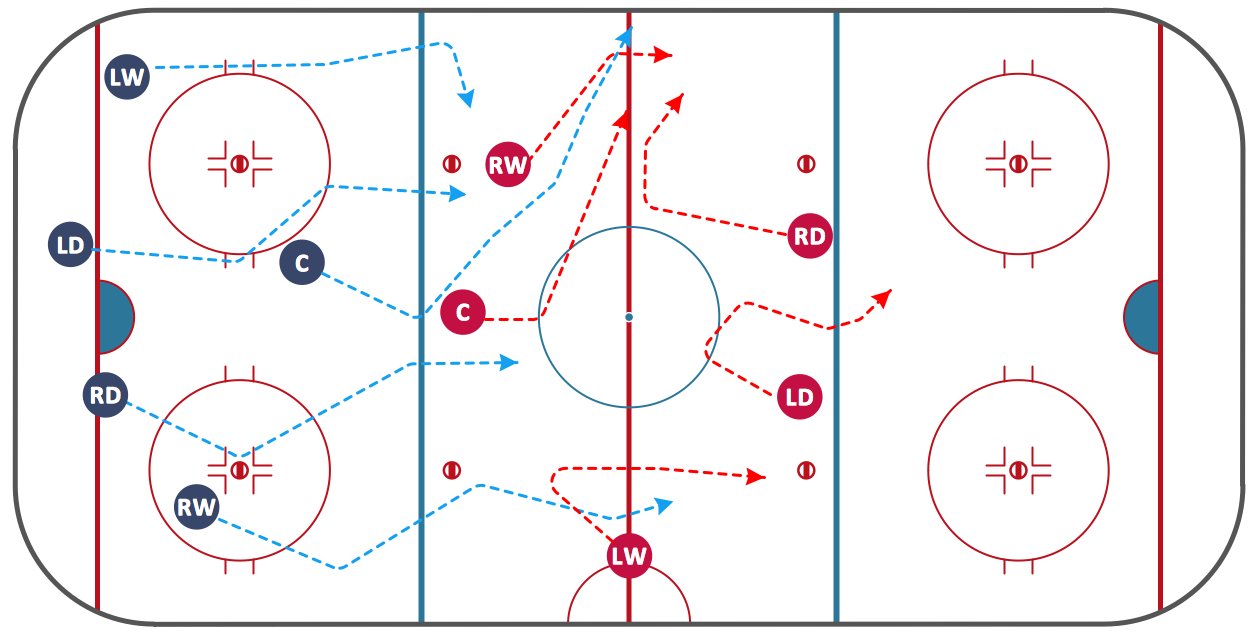
Ice Hockey Diagram — Defensive Strategy — Neutral Zone Trap

In ConceptDraw DIAGRAM you can produce ice hockey diagrams of any complexity for any presentaion needs, using a combination of tools. To adopt the sample below for presentation needs place positions and arrows onto different layers of your document and then make them visible one by one during a presentation.

How to Connect Social Media DFD Flowchart with Action Maps

The Social Media Response solution creates interactive social media flow charts and action mind maps. The solution includes a video tutorial and a number of samples helping social media teams refine and organize their response process.

Design Data Flow. DFD Library

Three DFD libraries, 49 vector shapes. Use these DFD symbol libraries to design the process-oriented models, data-oriented models, data flowcharts, data process diagrams, structured analysis diagrams, and information flow diagrams.

Entity Relationship Diagram - ERD - Software for Design Crows Foot ER Diagrams

Crow's Foot notation was proposed by Gordon Everest. According to this notation, the entity is represented by rectangle, relation is depicted by line which ties two entities involved in a relationship. Entity-relationship diagrams based on both Chen's and Crow's Foot notations, can be easily drawn using the ConceptDraw DIAGRAM ERD diagrams software tools for design element Crow's Foot and Chen from Entity-Relationship Diagram (ERD) solution.
How to Build an Entity Relationship Diagram (ERD)

How to Present a Social Media Response Plan DFD to Your Team

Interactive tool helps you find the appropriate response to social media mentions quickly. There are materials to help trainers and consultants develop a social media strategy and provide training for social media groups on how to effectively accomplish their daily work.

chess, chess game, online chess, chess board, chess rules, play chess online, play chess 3d chess, chess 3d, chessboard, online chess game, chess game online, computer chess Chess

chess, chess game, online chess, chess board, chess rules, play chess online, play chess 3d chess, chess 3d, chessboard, online chess game, chess game online, computer chess
Chess solution extends ConceptDraw DIAGRAM application with samples, special templates and libraries of 2D and 3D elements of chessboards and chess pieces to help display any events on the chessboard, to illustrate the winning positions and chess combinations, to analyze the famous games played by prominent chess masters, to simulate gambits, to teach the audience to play chess and to demonstrate visually the chess rules, to show the variations of moves and ways of setting the checkmate to opponent in a fewest number of steps. Special template ConceptDraw DIAGRAM allows to play chess on a local network.

Property Management Examples

This sample was created in ConceptDraw DIAGRAM diagramming and vector drawing software using the Seven Management and Planning Tools Solution from the Business Productivity area of ConceptDraw Solution Park.
This sample shows the Property Management matrix, the ideas are ordered in regards to importance and frequency. This matrix gives the ability to turn the theory into quantifiable data.