Work Flow Process Chart

Flow Chart Design - How to Design a Good Flowchart

Process Flowchart


Technical Flow Chart

Work Flow Chart

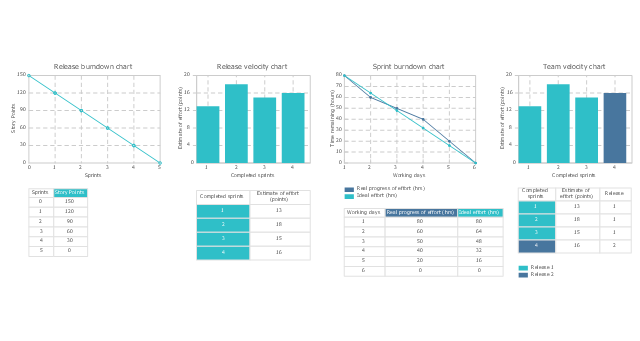
The vector stencils library "Scrum charts" contains 4 templates: release burndown chart, sprint burndown chart, release velocity chart and team velocity chart. Use it to design your agile software development charts and infographics.
"A burn down chart is a graphical representation of work left to do versus time. The outstanding work (or backlog) is often on the vertical axis, with time along the horizontal. That is, it is a run chart of outstanding work. It is useful for predicting when all of the work will be completed. It is often used in agile software development methodologies such as Scrum. However, burn down charts can be applied to any project containing measurable progress over time.
Outstanding work can be represented in terms of either time or story points." [Burn down chart. Wikipedia]
The burn down and velocity charts sample "Design elements - Scrum charts" is included in the Scrum solution from the Project Management area of ConceptDraw Solution Park.
Burn down and velocity charts
Technical Flow Chart Example

Flow chart Example. Warehouse Flowchart


Scrum process work items and workflow

"Classic TQM Tools ...
Flow Charts Pictures, symbols or text coupled with lines, arrows on lines show direction of flow. Flowcharting enables
modeling of processes; problems/ opportunities and decision points etc. It develops a common understanding of a process by those in
volved." [whaqualitycenter.org/ Portals/ 0/ Tools%20 to%20 Use/ Classic%20 Quality%20 Tools/ Classic%20 TQM%20 Tools%20 R%20 2-12.pdf]
The vector stencils library TQM diagrams contains 58 symbols for drawing total quality management (TQM) flow charts using the ConceptDraw PRO diagramming and vector drawing software.
The example "Design elements - TQM diagram" is included in the Total Quality Management (TQM) Diagrams solution from the Quality area of ConceptDraw Solution Park.
TQM flow chart symbols

- Chart Work Design
- Chart Work Designs
- Flowchart design . Flowchart symbols, shapes, stencils and icons ...
- Work Chart Designs
- Process Flowchart | Interior Design | Activity Network (PERT) Chart ...
- Project management - Design Elements | Work Flow Chart | Design ...
- How to Design a Good Workflow | Drawing Workflow Diagrams ...
- How to Draw a Pictorial Chart in ConceptDraw PRO | How to Draw ...
- Design elements - Workflow departments | Flow Of Work In The ...
- How to Draw an Organization Chart | Marketing and Sales ...