This IDEF0 diagram example was redesigned from the Wikimedia Commons file: 6 Decomposition Structure.svg.
[commons.wikimedia.org/ wiki/ File:6_ Decomposition_ Structure.svg]
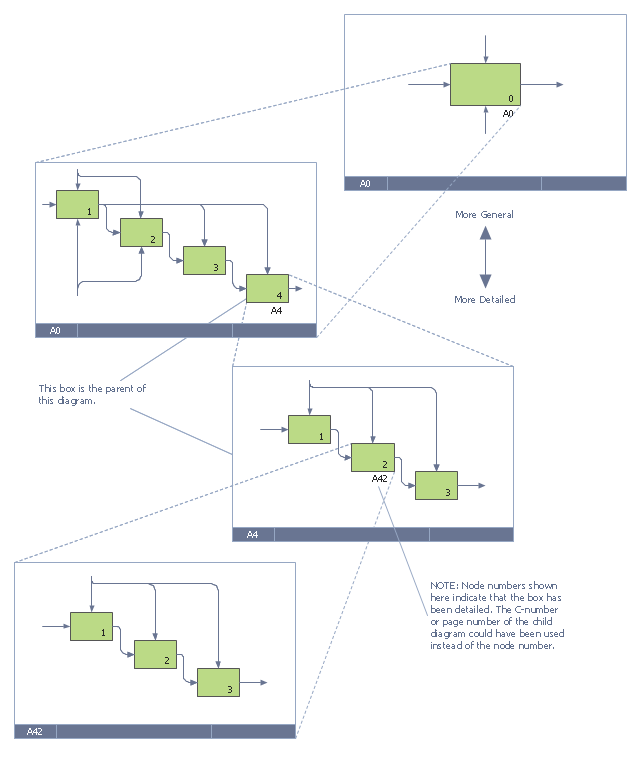
"Functional decomposition refers broadly to the process of resolving a functional relationship into its constituent parts in such a way that the original function can be reconstructed (i.e., recomposed) from those parts by function composition. In general, this process of decomposition is undertaken either for the purpose of gaining insight into the identity of the constituent components (which may reflect individual physical processes of interest, for example), or for the purpose of obtaining a compressed representation of the global function, a task which is feasible only when the constituent processes possess a certain level of modularity (i.e., independence or non-interaction). Interactions between the components are critical to the function of the collection. All interactions may not be observable, but possibly deduced through repetitive perception, synthesis, validation and verification of composite behavior." [Functional decomposition. Wikipedia]
The example "IDEF0 diagram - Decomposition structure" was created using the ConceptDraw PRO diagramming and vector drawing software extended with the solution "IDEF Business Process Diagrams" from the area "Business Processes" of ConceptDraw Solution Park.
[commons.wikimedia.org/ wiki/ File:6_ Decomposition_ Structure.svg]
"Functional decomposition refers broadly to the process of resolving a functional relationship into its constituent parts in such a way that the original function can be reconstructed (i.e., recomposed) from those parts by function composition. In general, this process of decomposition is undertaken either for the purpose of gaining insight into the identity of the constituent components (which may reflect individual physical processes of interest, for example), or for the purpose of obtaining a compressed representation of the global function, a task which is feasible only when the constituent processes possess a certain level of modularity (i.e., independence or non-interaction). Interactions between the components are critical to the function of the collection. All interactions may not be observable, but possibly deduced through repetitive perception, synthesis, validation and verification of composite behavior." [Functional decomposition. Wikipedia]
The example "IDEF0 diagram - Decomposition structure" was created using the ConceptDraw PRO diagramming and vector drawing software extended with the solution "IDEF Business Process Diagrams" from the area "Business Processes" of ConceptDraw Solution Park.
IDEF0 business process diagram
IDEF0 standard with ConceptDraw DIAGRAM

Circle Diagrams

IDEF3 Standard

Data structure diagram with ConceptDraw DIAGRAM

 IDEF Business Process Diagrams
Use the IDEF Business Process Diagrams solution to create effective database designs and object-oriented designs, following the integration definition methodology.
Types of Flowcharts


UML Use Case Diagram Example. Social Networking Sites Project

UML Use Case Diagram Example. Registration System

Developing Entity Relationship Diagrams

- IDEF0 diagram - Decomposition structure | IDEF4 Standard | IDEF ...
- Functional Decomposition Diagram For Library Management System
- What Is A Functional Decomposition Diagram
- IDEF4 Standard | Data structure diagram with ConceptDraw PRO ...
- IDEF0 diagram - Decomposition structure | Business diagrams & Org ...
- Structural Decomposition Diagram Social Network
- Decomposition Flow Diagram Of Resort Reservation
- Functional Decomposition Diagram Visio
- Decomposition Of Library Management System Dfd
- Draw A Functional Decomposition Structured Chart Diagram For