Use it to create temporal infographic, illustrations and diagrams.
The pictograms example "Design elements - Time and clock pictograms" was created using the ConceptDraw PRO diagramming and vector drawing software extended with the Pictorial Infographic solution from the area "What is infographics" in ConceptDraw Solution Park.
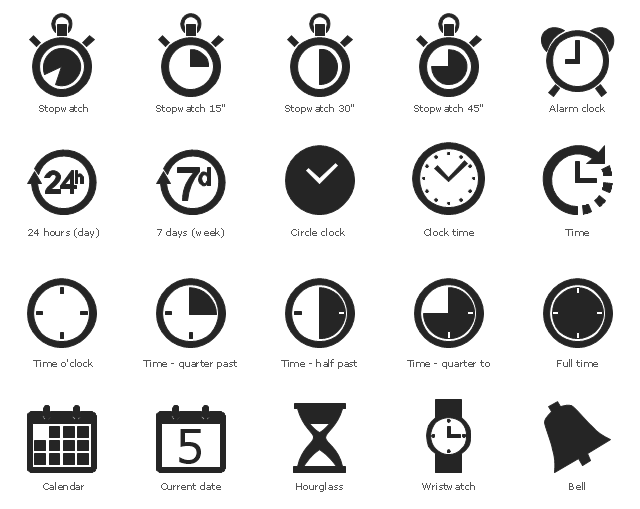
Use it to create temporal infographic, illustrations and diagrams.
The example "Time and clock pictograms - Vector stencils library" was created using the ConceptDraw PRO diagramming and vector drawing software extended with the Pictorial infographics solution from the area "What is infographics" in ConceptDraw Solution Park.


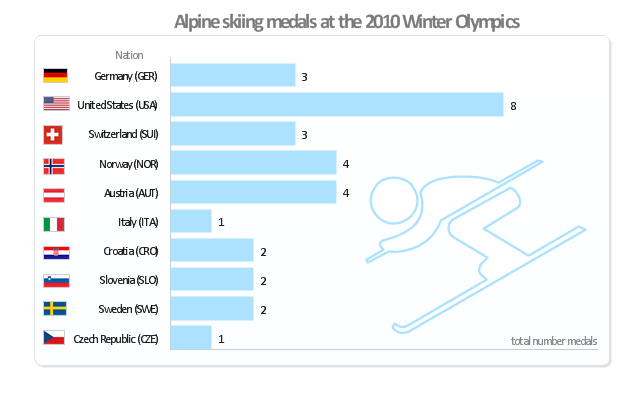
Winter Sports Vector Clipart. Medal Map. Spatial Infographics

This medal bar chart example "Alpine skiing at the 2010 Winter Olympics" was created using the ConceptDraw PRO diagramming and vector drawing software extended with the Winter Sports solution.
The Winter Sports solution from the Sport area of ConceptDraw Solution Park contains the vector stencils library "Winter sports pictograms" and examples of diagrams and infographics.
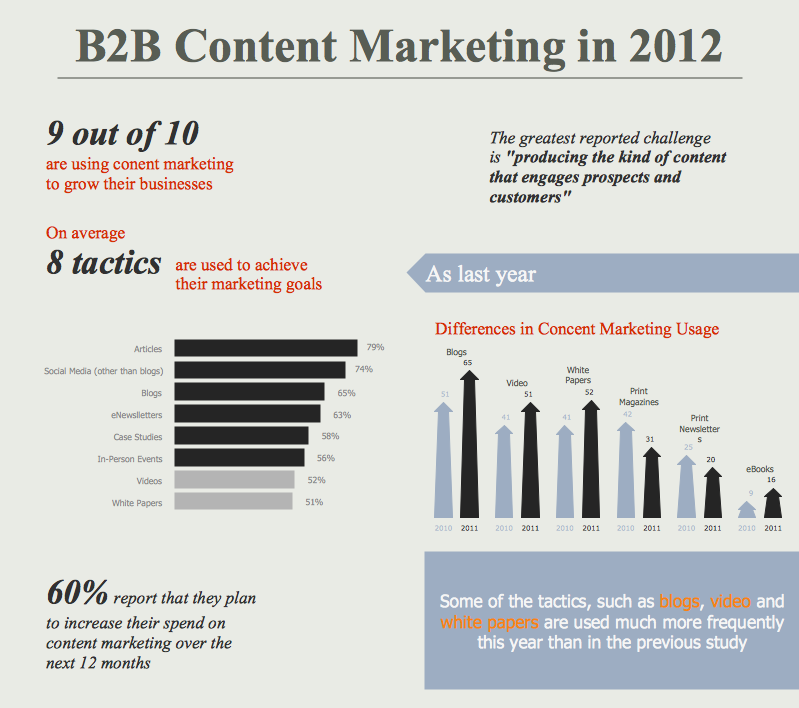
Content Marketing Infographics
 Winter Sports
Management Consultant
A management consultant is an important person for the company, he helps in the questions of improving business performance and increasing profits, he consults for the questions of business strategy, management and financial controls, resources, and also suggests recommendations for changing the structure of the company if needed.
So, every day management consultant conduct the complex work and often use the helpful management infographics for explain his thoughts and arguments to the company direction. Thanks to the development of computer technologies, drawing of management infographics is so easy today. ConceptDraw DIAGRAM diagramming and vector drawing software offers you the Management Infographics Solution from the Business Infographics Area.
Social Media Marketing Infographic

ERD Symbols and Meanings


 Soccer
"Weather is the state of the atmosphere, to the degree that it is hot or cold, wet or dry, calm or stormy, clear or cloudy. Most weather phenomena occur in the troposphere, just below the stratosphere. Weather generally refers to day-to-day temperature and precipitation activity, whereas climate is the term for the average atmospheric conditions over longer periods of time. When used without qualification, "weather", is generally understood to mean the weather of Earth.
Weather is driven by air pressure (temperature and moisture) differences between one place and another. These pressure and temperature differences can occur due to the sun angle at any particular spot, which varies by latitude from the tropics. The strong temperature contrast between polar and tropical air gives rise to the jet stream. Weather systems in the mid-latitudes, such as extratropical cyclones, are caused by instabilities of the jet stream flow. Because the Earth's axis is tilted relative to its orbital plane, sunlight is incident at different angles at different times of the year. On Earth's surface, temperatures usually range ±40°C (−40°F to 100°F) annually. Over thousands of years, changes in Earth's orbit affect the amount and distribution of solar energy received by the Earth and influence long-term climate and global climate change." [Weather. Wikipedia]
The clip art example "Weather - Vector stencils library" was created using the ConceptDraw PRO diagramming and vector drawing software extended with the Nature solution from the Illustration area of ConceptDraw Solution Park.
www.conceptdraw.com/ solution-park/ illustrations-nature


- Marketing Plan Infographic | Market Day Pictogram
- Time and clock pictograms - Vector stencils library | Time and clock ...
- Time and clock pictograms - Vector stencils library | Time and clock ...
- Time and clock pictograms - Vector stencils library | How to ...
- Working Day Pictogram
- Time and clock pictograms - Vector stencils library | Time and clock ...
- Time and clock pictograms - Vector stencils library | Design ...
- Design elements - Marketing pictograms | Design elements ...
- Sochi 2014 Olympics - Men's hockey tournament schedule ...
- Calendars - Vector stencils library | Design elements - Calendars ...
- Design elements - Time and clock pictograms | Time and clock ...
- Design elements - Time and clock pictograms | Time and clock ...
- Sochi 2014 Olympics - Men's hockey tournament schedule ...
- Time and clock pictograms - Vector stencils library | Time and clock ...
- How to Create Multple Projects Schedule on Windows | How to ...
- Design elements - Marketing pictograms
- Time and clock pictograms - Vector stencils library | Time and clock ...
- Time and clock pictograms - Vector stencils library | Time - Design ...
- Time and clock pictograms - Vector stencils library | How To use ...