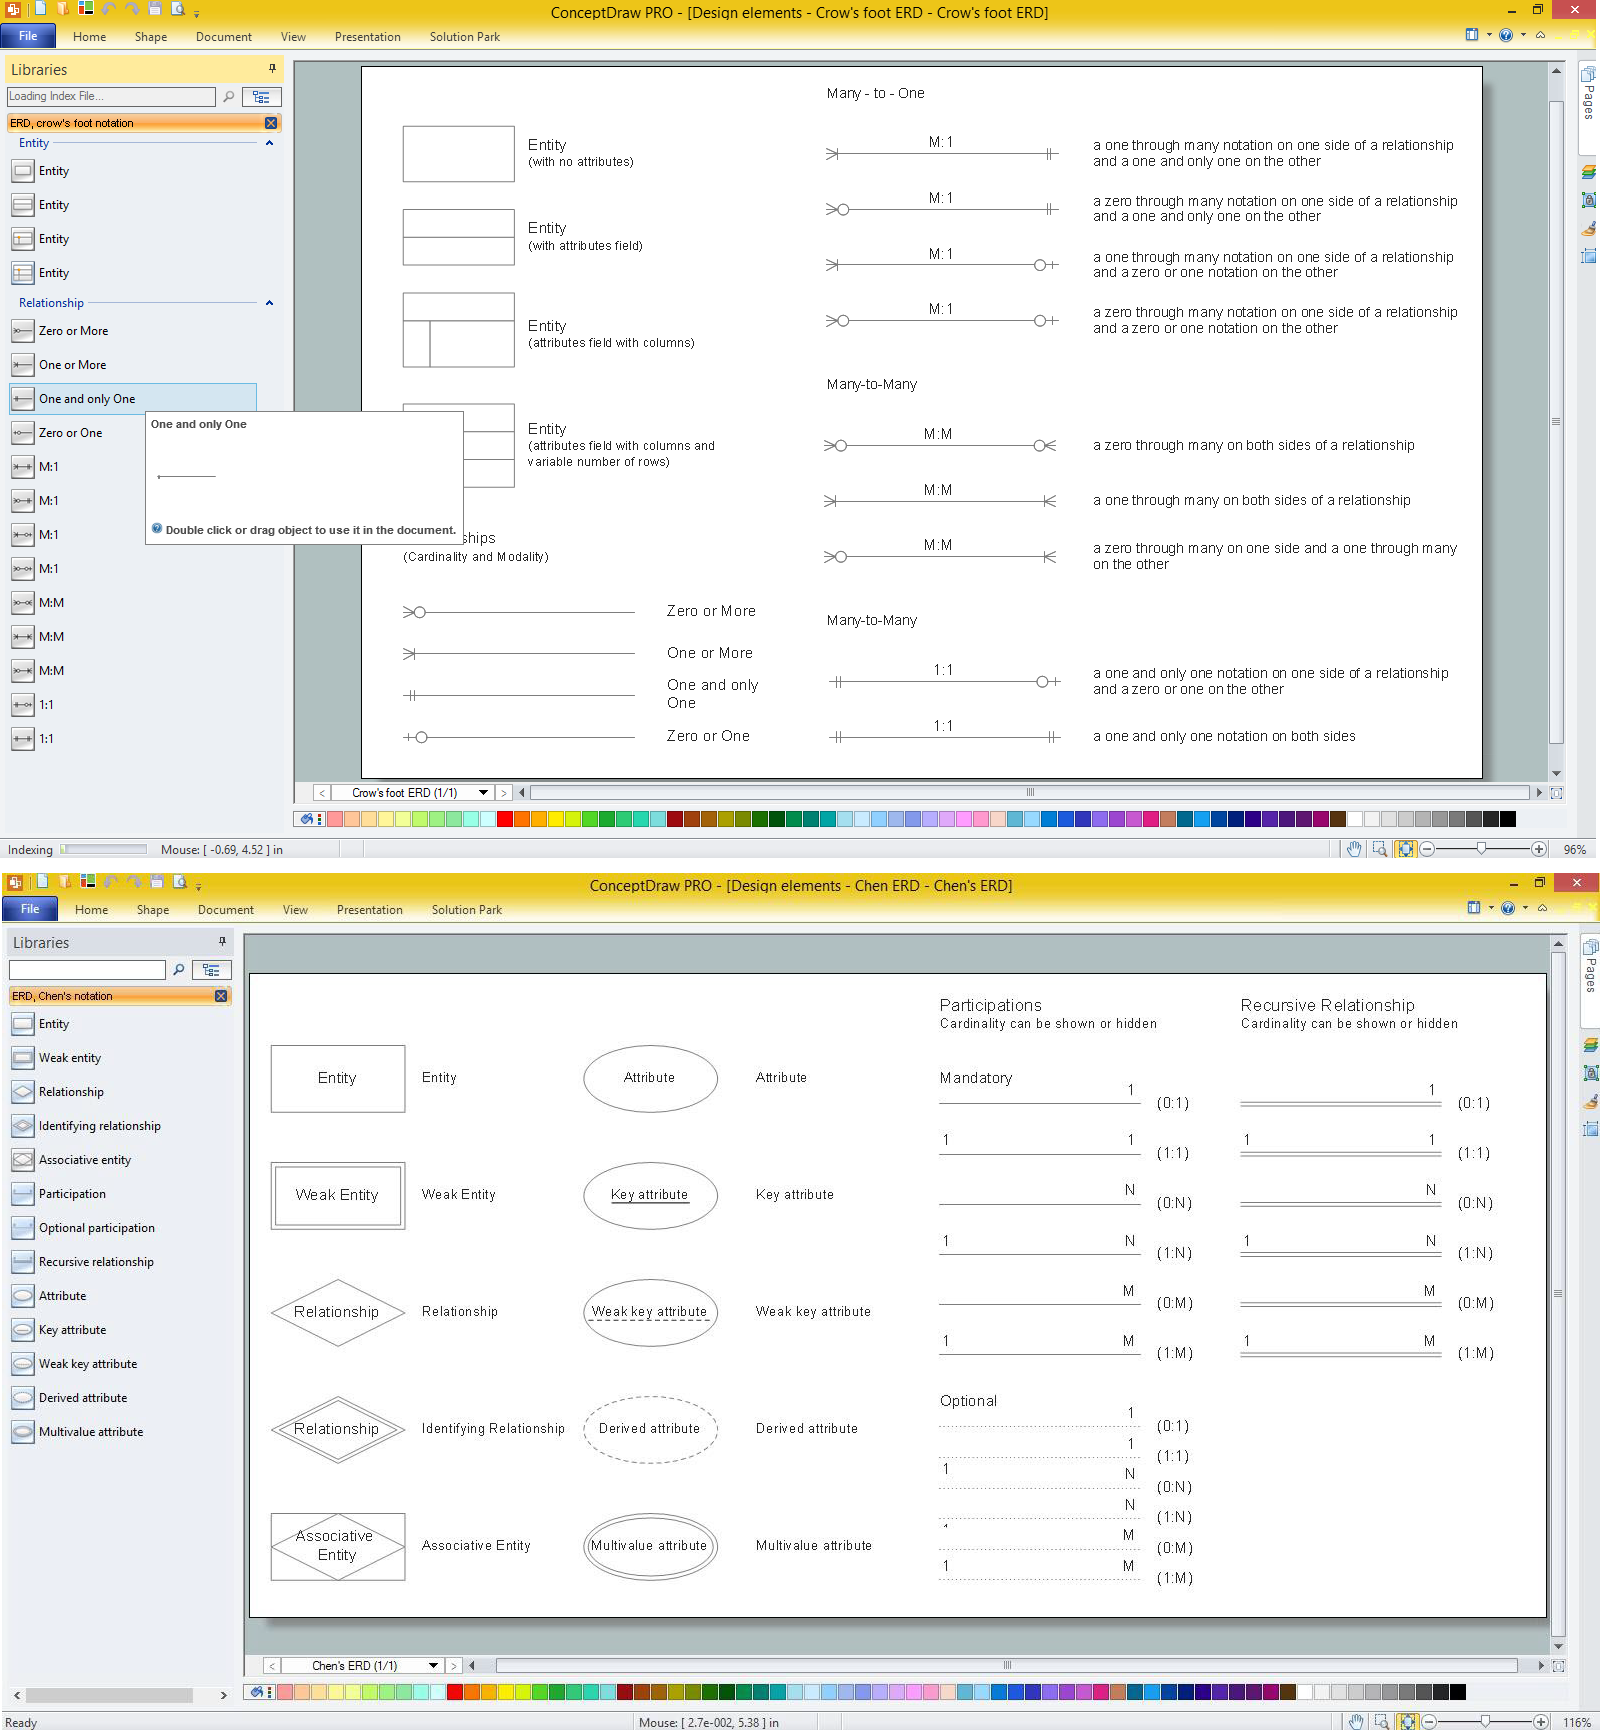
ERD Symbols and Meanings


Entity Relationship Diagram Symbols

 Object-Role Modeling (ORM) Diagrams
Object-role Modeling (ORM) Diagram solution with powerful vector diagramming and data modeling tools, large quantity of specially developed samples and examples, and rich variety of vector objects corresponding to common ORM notation, ideally suits for developing the comprehensive, clear and visual Object-role Modeling (ORM) diagrams and schematics, understandable for all interested people from the different fields and business directions, for designing the ORM models, and demonstrating advantages from the use of ORM and its notation. It is intended for software developers and computer engineers, specialists in a field of Object-oriented programming (OOP), database architects, web-application constructors and developers, etc.
Notation & Symbols for ERD

Anyone Have an ERD Symbols Quick Reference?
Business Process Workflow Diagram


Use Case Diagrams technology with ConceptDraw DIAGRAM

Education Information
 Health Package
Health Package is a set of multifaceted solutions intended for visualization and illustration in a field of medicine and health, for drawing colorful, interesting and precise illustrations and infographics that will be used successfully in medical documents, articles, special magazines, posters, billboards, websites, presentations, collages. Having these solutions available, it will not be difficult to illustrate the medical editions, to convey the information in a full and interesting form, to teach students with use effective visual methods, to describe the medical facts, to tell about innovations in a field of medicine, health and correct nutrition, to explain the causes and consequences of different diseases, as well as the measures of their prevention and treatment.
 Business Diagrams Package
Business Diagrams Package is a large set of comprehensive graphical solutions from the ConceptDraw Solution Park, which are powerful in solving the business, marketing and quality tasks in completely different fields, such as finance, education, health food and cooking, HR, and many others. The tools of this package's solutions are a powerful assistant in drawing all diversity of Financial and Marketing infographics, Business process workflow diagrams, Organizational charts, Education infographics, Quality diagrams, Health food diagrams, HR flowcharts, as well as different graphics and charts, which depict the values of key business indicators, their dependencies, give the full understanding of a situation within a company and on the market.
- Entity Relationship Diagram Symbols | ERD Symbols and Meanings ...
- Design elements - Management connectors | Garrett IA Diagrams ...
- Solid Shape Diagram
- Design elements - IDEF3 process schematic symbols | Vector ...
- TQM Diagram Tool | Astronomy and Astrology | Astronomy ...
- Packaging, loading, customs - Vector stencils library | How to Create ...
- Diagram Of Symbols Or Instance
- Sequence Diagram How To Draw Asynchronous
- Design elements - Internal block diagram | Design elements ...
- Design elements - Vessels | Vessels - Vector stencils library ...