 Status Dashboard
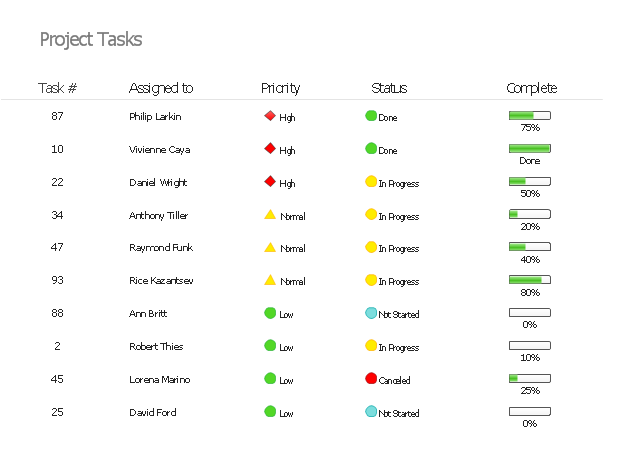
Status dashboard solution extends ConceptDraw PRO software with templates, samples and vector stencils libraries with graphic indicators for drawing the visual dashboards showing status data.
This example was created using ConceptDraw PRO diagramming and vector drawing software extended with Status Dashboard solution from "What is a Dashboard" area of ConceptDraw Solution Park. https:/ / www.conceptdraw.com/ solution-park/ status-dashboard
Dashboard
 What is a Dashboard Area
Solutions from the area What is a Dashboard of ConceptDraw Solution Park collects templates, samples and vector stencils libraries with of data driven charts and indicators for drawing the basic types of Visual Dashboards.
 PM Dashboards
This solution extends ConceptDraw PRO and ConceptDraw PROJECT software with the ability to clearly display the identified key performance indicators for any project.
 Spatial Dashboard
Spatial dashboard solution extends ConceptDraw PRO software with templates, samples and vector stencils libraries with thematic maps for drawing visual dashboards showing spatial data.
 Composition Dashboard
Composition dashboard solution extends ConceptDraw PRO software with templates, samples and vector stencils library with charts and indicators for drawing visual dashboards showing data composition.
 Meter Dashboard
Meter dashboard solution extends ConceptDraw PRO software with templates, samples and vector stencils library with meter indicators for drawing visual dashboards showing quantitative data.
 PM Presentations
This solution extends ConceptDraw MINDMAP and ConceptDraw PRO software, improving the efficiency of the project management process by using the same source data to build targeted presentations.
 Frequency Distribution Dashboard
Frequency distribution dashboard solution extends ConceptDraw PRO software with samples, templates and vector stencils libraries with histograms and area charts for drawing the visual dashboards showing frequency distribution of data.
 ConceptDraw Dashboard for Facebook
ConceptDraw Dashboard for Facebook solution extends ConceptDraw PRO software with a dynamically updated visual dashboard, which shows lifetime total likes, daily friends of fans, and daily page views, information you can receive from Facebook Insights.
 Time Series Dashboard
Time series dashboard solution extends ConceptDraw PRO software with templates, samples and vector stencils libraries with charts, graphs and plots for drawing the visual dashboards showing data time series.
 Sales Dashboard
Sales Dashboard solution extends ConceptDraw PRO software with templates, samples and library of vector stencils for drawing the visual dashboards of sale metrics and key performance indicators (KPI).
 Comparison Dashboard
Comparison dashboard solution extends ConceptDraw PRO software with samples, templates and vector stencils library with charts and indicators for drawing the visual dashboard comparing data.
- Status Dashboard | PM Teams | PM Agile |
- Status Dashboard | Project task status dashboard | What is a ...
- Status Dashboard | Sales Dashboard Template | Composition ...
- Status Dashboard | Meter Dashboard | Composition Dashboard |
- Status Dashboard | PM Dashboards | Sales Dashboard Examples |
- Meter Dashboard | Status Dashboard | Spatial Dashboard |
- Status Dashboard | PM Dashboards | How To Create Project Report |
- Status Dashboard | What is a Dashboard Area | Measure the Progress
- Status Dashboard | Sales Dashboard Examples | Sales Dashboard ...
- Status Dashboard | Meter Dashboard | Sales Dashboard |
- Sales Dashboard Template | Sales Dashboard Examples | Status ...
- Spatial Dashboard | Meter Dashboard | Status Dashboard |
- Status Dashboard | PM Dashboards | PM Presentations |
- What is a Dashboard Area | Status Dashboard | PM Dashboards |
- Status Dashboard | Project task status dashboard | How To Hold ...
- Meter Dashboard | Status Dashboard | Visualize Sales Data Using ...
- Sales Dashboard Examples | Meter Dashboard | Status Dashboard |
- Status Dashboard | PM Dashboards | How To Create Project Report |
- Sales Dashboard Template | Sales Dashboard Examples | Sales ...
- Spatial Dashboard | Spatial dashboard sample | Europe spatial ...