How To Create Project Report

Business Diagram Software


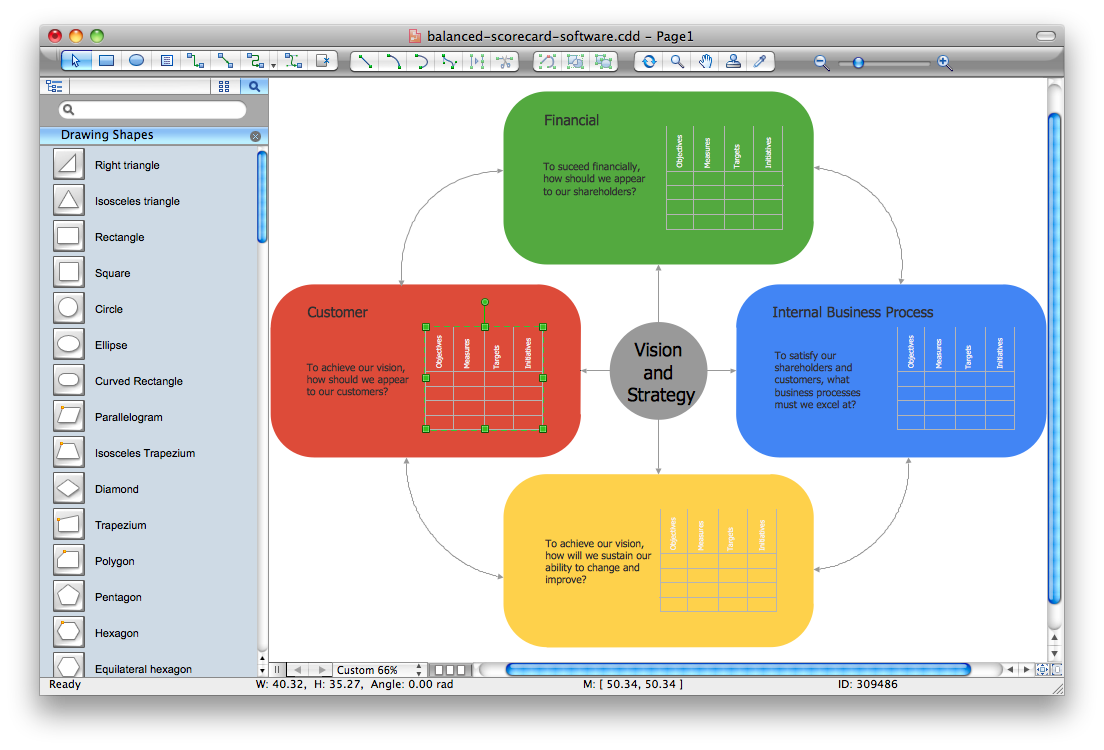
Balanced Scorecard Software
KPI Dashboard

 Sales Dashboard
Sales Dashboard solution extends ConceptDraw DIAGRAM software with templates, samples and library of vector stencils for drawing the visual dashboards of sale metrics and key performance indicators (KPI).
Dashboard

Business Intelligence Dashboard Software
 Comparison Dashboard
Comparison dashboard solution extends ConceptDraw DIAGRAM software with samples, templates and vector stencils library with charts and indicators for drawing the visual dashboard comparing data.
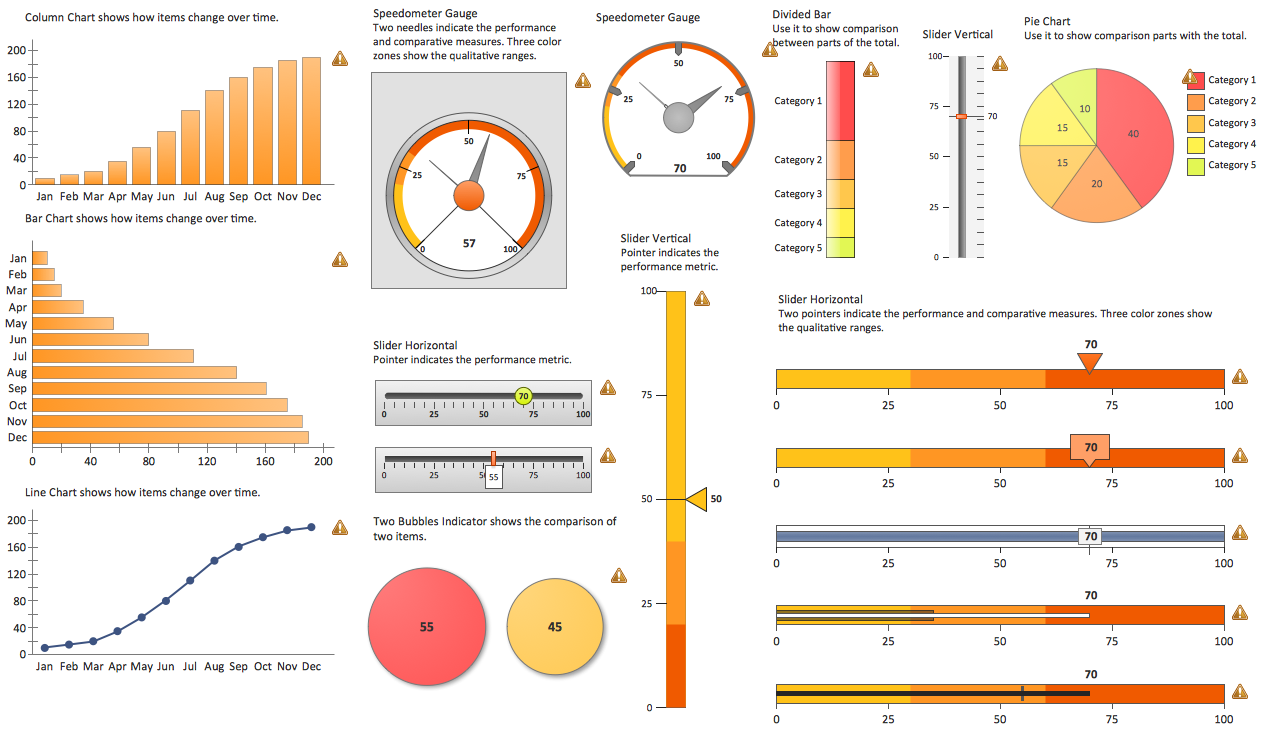
 Meter Dashboard
Meter dashboard solution extends ConceptDraw DIAGRAM software with templates, samples and vector stencils library with meter indicators for drawing visual dashboards showing quantitative data.
 Telecommunication Network Diagrams
Telecommunication Network Diagrams solution extends ConceptDraw DIAGRAM software with samples, templates, and great collection of vector stencils to help the specialists in a field of networks and telecommunications, as well as other users to create Computer systems networking and Telecommunication network diagrams for various fields, to organize the work of call centers, to design the GPRS networks and GPS navigational systems, mobile, satellite and hybrid communication networks, to construct the mobile TV networks and wireless broadband networks.
 Plant Layout Plans
Plant Layout Plans solution can be used for power plant design and plant layout design, for making the needed building plant plans and plant layouts looking professionally good. Having the newest plant layout software, the plant design solutions and in particular the ConceptDraw’s Plant Layout Plans solution, including the pre-made templates, examples of the plant layout plans, and the stencil libraries with the design elements, the architects, electricians, interior designers, builders, telecommunications managers, plant design engineers, and other technicians can use them to create the professionally looking drawings within only a few minutes.
How to Report Task's Execution with Gantt Chart

 ConceptDraw Solution Park
ConceptDraw Solution Park collects graphic extensions, examples and learning materials
 Computer and Networks Area
The solutions from Computer and Networks Area of ConceptDraw Solution Park collect samples, templates and vector stencils libraries for drawing computer and network diagrams, schemes and technical drawings.
 Correlation Dashboard
Correlation dashboard solution extends ConceptDraw DIAGRAM software with samples, templates and vector stencils library with Scatter Plot Charts for drawing the visual dashboard visualizing data correlation.
- Free Download Project Manager
- Dashboard Project Management Kpi
- Project Dashboard Examples Free
- Dashboard Ppt Template Free Download
- Project Management Dashboards Examples
- PM Dashboards | Project management task status dashboard | How ...
- Dashboard Management Software
- Project —Task Trees and Dependencies | Project management task ...
- Dashboard Design Powerpoint Free Download
- Project Management System Free
- Percentage Pie Chart. Pie Chart Examples | TQM Diagram Example ...
- KPI Dashboard | What is a KPI? | Dashboard | Free Kpi Template Excel
- Basic Task Status Dashboard Template Free Download
- Sales Kpi Dashboard Free Download In Excel
- What is a Dashboard Area | Dashboard Software | Business ...
- Software Project Dashboard Template
- Status Dashboard | How To Create Project Report | Gantt chart ...
- Kpi Dashboard Excel Download
- Project task status dashboard - Template
- Sales Dashboard | Sales Dashboard - Access Anywhere | Business ...