KPIs and Metrics

 Business Intelligence Dashboard
Business Intelligence Dashboard solution extends the ConceptDraw DIAGRAM functionality with exclusive tools, numerous ready-to-use vector objects, samples and quick-start templates for creation professional Business Intelligence Dashboards, Business Intelligence Graphics, Business Intelligence Charts and Maps of different kinds. Design easy the BI dashboard, BI model or Dynamic chart in ConceptDraw DIAGRAM to monitor the company's work, to track the indicators corresponding your company's data, to display and analyze key performance indicators, to evaluate the trends and regularities of the processes occurring at the company.
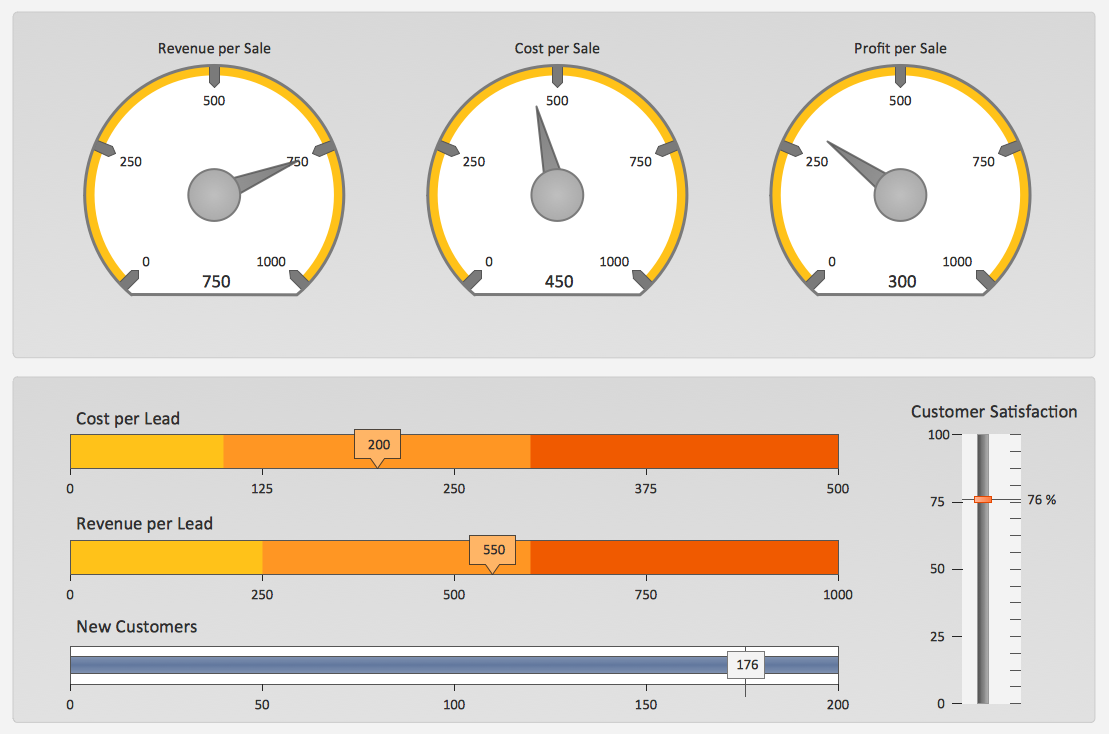
KPI Dashboard

Sales KPI Dashboards
Sales Teams are Inherently Competitive
 Accounting Flowcharts
Accounting Flowcharts solution extends ConceptDraw DIAGRAM software with templates, samples and library of vector stencils for drawing the accounting flow charts.
 Cross-Functional Flowcharts
Cross-functional flowcharts are powerful and useful tool for visualizing and analyzing complex business processes which requires involvement of multiple people, teams or even departments. They let clearly represent a sequence of the process steps, the order of operations, relationships between processes and responsible functional units (such as departments or positions).
 Audit Flowcharts
Audit flowcharts solution extends ConceptDraw DIAGRAM software with templates, samples and library of vector stencils for drawing the audit and fiscal flow charts.
Sales Analytics
- Logistics Flow Charts | Frequency Distribution Dashboard | Cisco ...
- Frequency Distribution Dashboard | Business Process Mapping ...
- Enterprise dashboard | Business process Flow Chart - Event-Driven ...
- Flowchart Software | ConceptDraw Dashboard for Facebook ...
- KPI Dashboard | KPIs and Metrics | Business Graphics Software ...
- Frequency Distribution Dashboard | Logistics Flow Charts | Order ...
- Sales Process Flowcharts | Sales Dashboard | Bar Chart Template ...
- Sales Dashboard | Target and Circular Diagrams | Flowchart For ...
- Projects HR dashboard | Cross-Functional Flowcharts | HR ...
- ConceptDraw Dashboard for Facebook | UML Use Case Diagram ...