In marketing perceptual or positioning maps are used for developing the market positioning strategy for product or service.
"Perceptual mapping is a diagrammatic technique used by asset marketers that attempts to visually display the perceptions of customers or potential customers. Typically the position of a product, product line, brand, or company is displayed relative to their competition." [Perceptual mapping. Wikipedia]
This positioning map diagram example was created using the ConceptDraw PRO diagramming and vector drawing software extended with the Matrices solution from the Marketing area of ConceptDraw Solution Park.
Perceptual map

Pyramid Chart Examples

Pyramid Charts

Pyramid Diagram and Pyramid Chart

Business Tools Perceptual Mapping

 Matrices
This solution extends ConceptDraw DIAGRAM software with samples, templates and library of design elements for drawing the business matrix diagrams.
Matrices
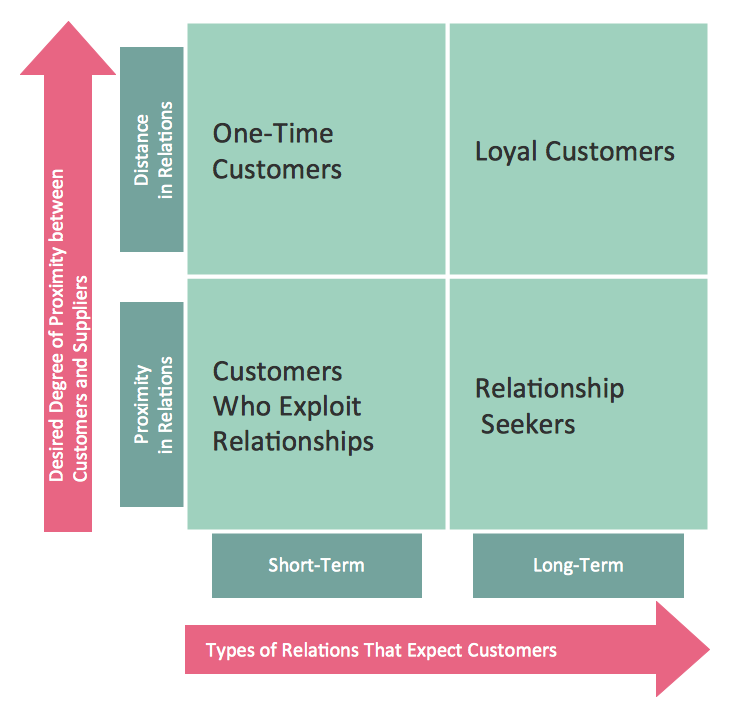
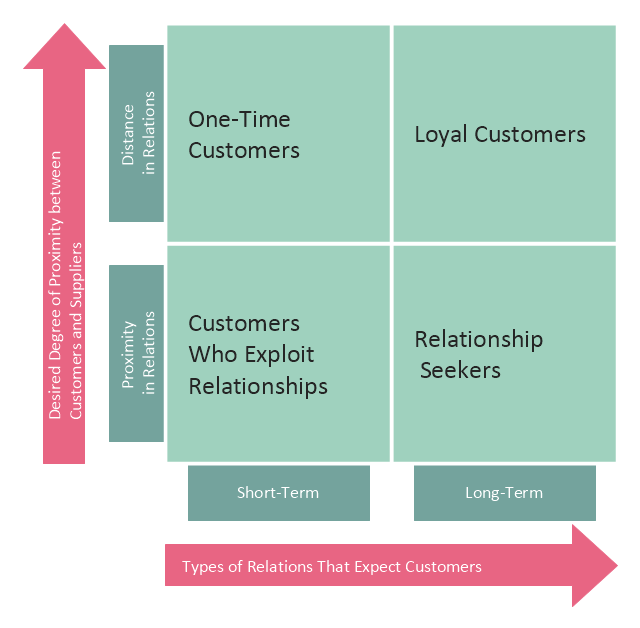
This customer types matrix diagram distribute customers into four categories depending of two criteria: 1) desired degree of proximity between customers and suppliers, and 2) types of relations that expect customers.
One time customers have short-term relations with suppliers and characterized by distance in relations with them.
Loyal customers have long-term relations with suppliers and characterized by distance in relations with them.
Customers who exploit relationships have short-term relations with suppliers and characterized by proximity in relations with them.
Relationship seekers have long-term relations with suppliers and characterized by proximity in relations with them.
This customer types matrix diagram example was created using the ConceptDraw PRO diagramming and vector drawing software extended with the Matrices solution from the Marketing area of ConceptDraw Solution Park.
Customer types diagram
Deployment Chart Software

Growth-Share Matrix Software

 Marketing Area
The solutions from Marketing area of ConceptDraw Solution Park collect templates, samples and libraries of vector stencils for drawing the marketing diagrams and mind maps.
- Business Tools Perceptual Mapping | Positioning map template ...
- Ansoff product/market growth matrix - Positioning matrix | Value ...
- Positioning map (Perceptual map) | Ansoff product market ...
- Positioning map | Positioning map - Template | Positioning Map ...
- Positioning map (Perceptual map) | Service 8 Ps fishbone diagram ...
- Block diagram - Six markets model | Positioning map | How To ...
- Marketing | Positioning map (Perceptual map) | SWOT Analysis Tool ...
- What is SWOT Analysis in Marketing | Positioning map (Perceptual ...
- Positioning map (Perceptual map) | SWOT Analysis Solution ...
- SWOT Analysis Solution - Strategy Tools | Positioning map ...
- Ansoff product/market growth matrix - Positioning matrix | Positioning ...
- Positioning map (Perceptual map) | GPS operation diagram ...
- Ansoff product/market growth matrix - Positioning matrix | Swot ...
- Matrices | Customer types matrix diagram | Competitive strategy ...
- Swot Analysis Examples
- Marketing | Marketing Analysis Diagram | Marketing Diagrams ...
- Swot Analysis Examples for Mac OSX | Ansoff product/market growth ...
- Pyramid Chart Examples | Positioning map (Perceptual map ...
- Marketing Diagrams | Pyramid Chart Examples | Service-goods ...
- Positioning map (Perceptual map) | Pyramid Chart Examples ...