Cross-Functional Flowchart - The easiest way to draw crossfunctional

HelpDesk
How to Draw Geometric Shapes

In searching of alternative to MS Visio for MAC and PC with ConceptDraw DIAGRAM

ERD Symbols and Meanings


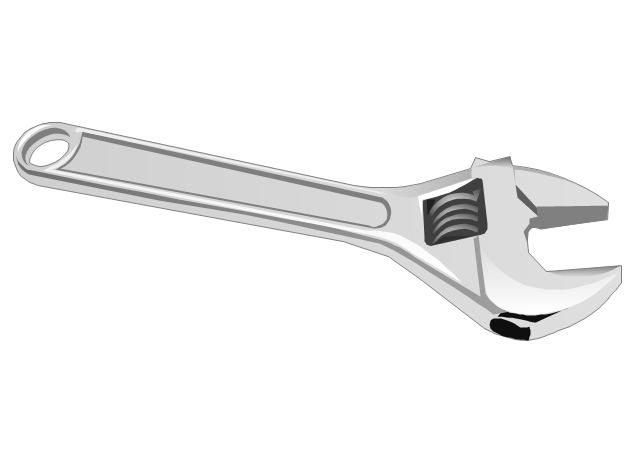
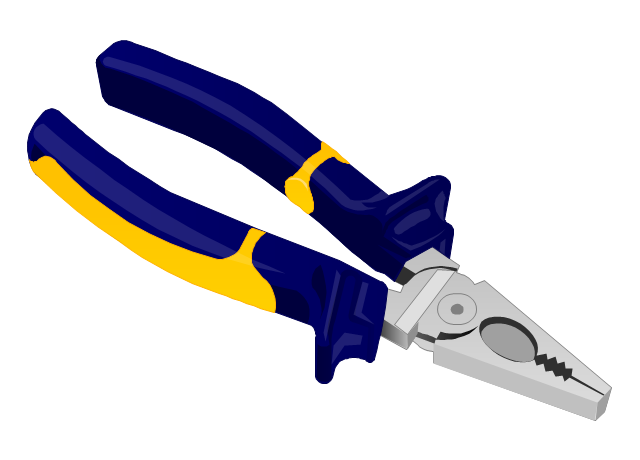
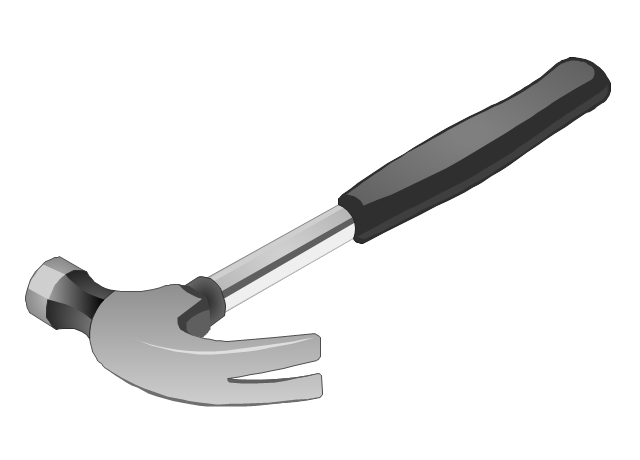
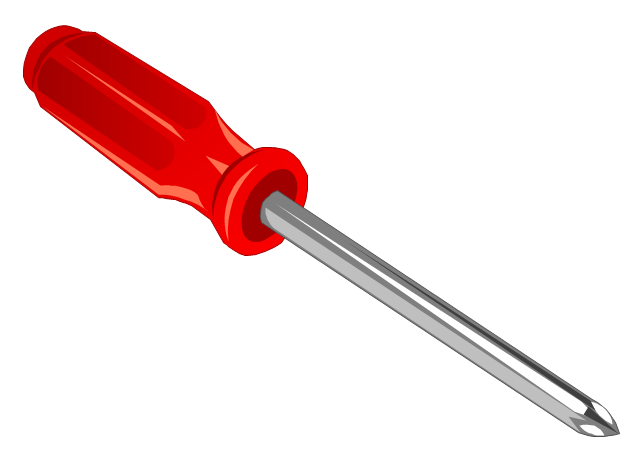
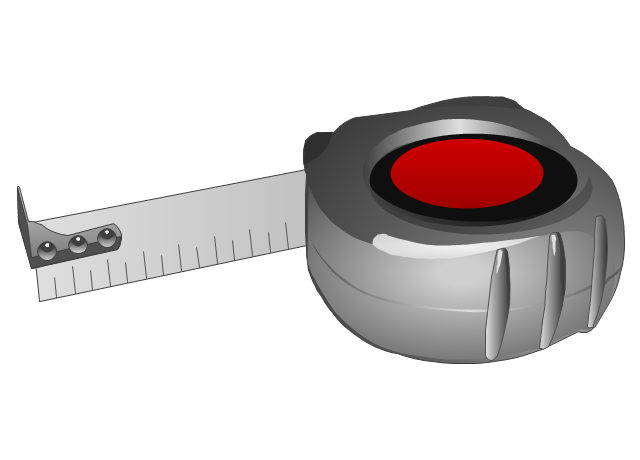
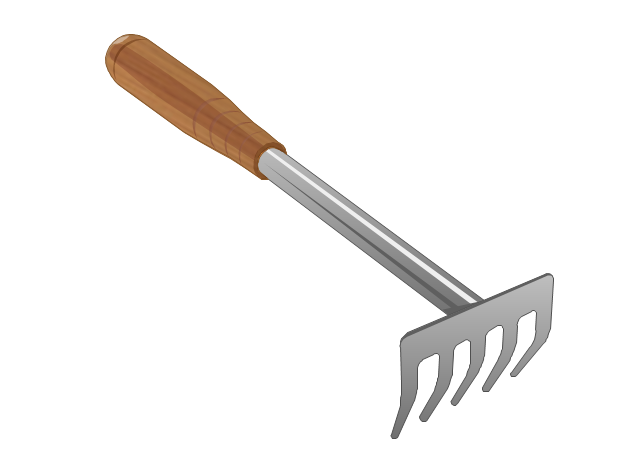
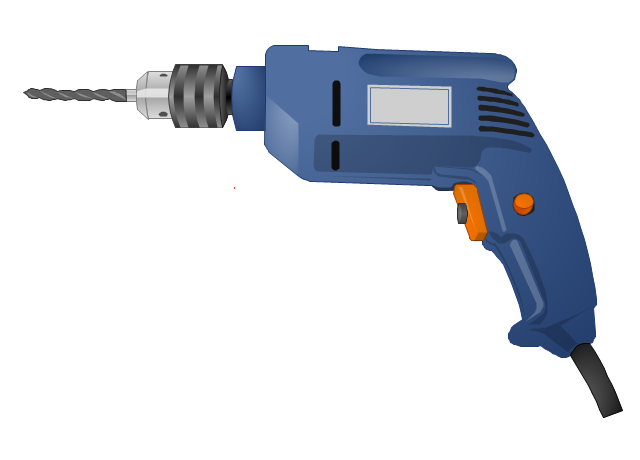
The vector stencils library "Tools" contains 11 clipart images of hand tools and instruments for drawing illustrations.
"A tool is any physical item that can be used to achieve a goal, especially if the item is not consumed in the process. Informally the word is also used to describe a procedure or process with a specific purpose. Tool use by humans dates back millions of years, and other animals are also known to employ simple tools.
Tools that are used in particular fields or activities may have different designations such as "instrument", "utensil", "implement", "machine", or "apparatus". The set of tools needed to achieve a goal is "equipment". The knowledge of constructing, obtaining and using tools is technology." [Tool. Wikipedia]
The clip art example "Tools - Vector stencils library" was created in ConceptDraw PRO diagramming and vector drawing software using the Manufacturing and Maintenance solution from the Illustration area of ConceptDraw Solution Park.
Adjustable spanner
Lineman's pliers
Claw hammer
Phillips screwdriver
Self-retracting tape measure
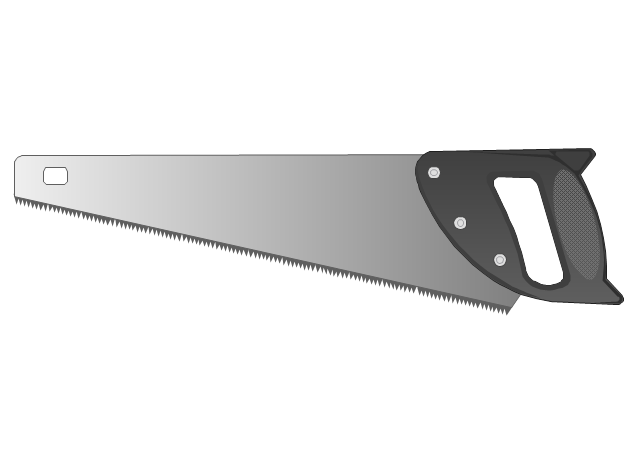
Crosscut hand saw
Nail

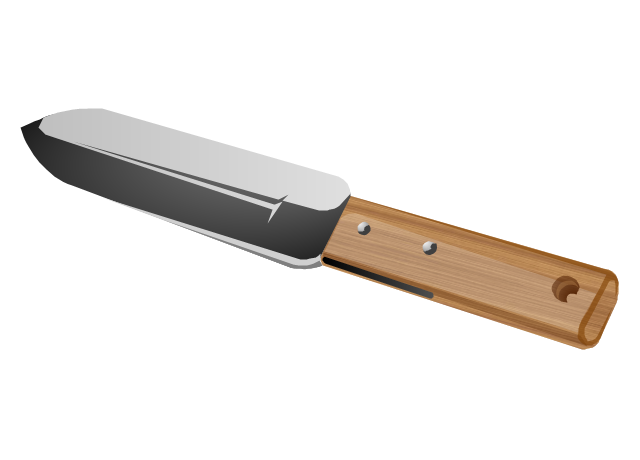
Hori-Hori garden knife
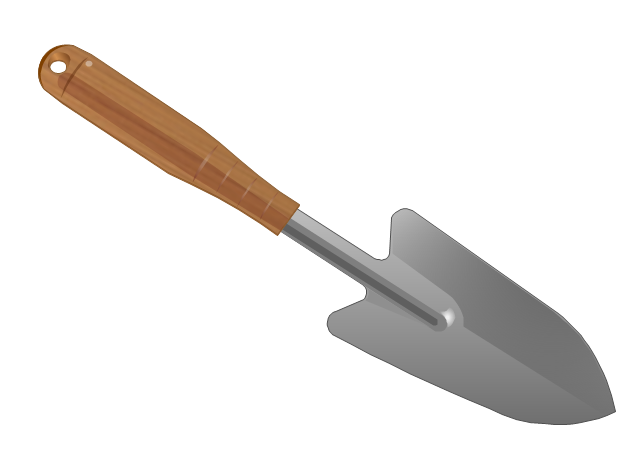
Gardening trowel
Garden rake
Pistol-grip electric drill
HelpDesk
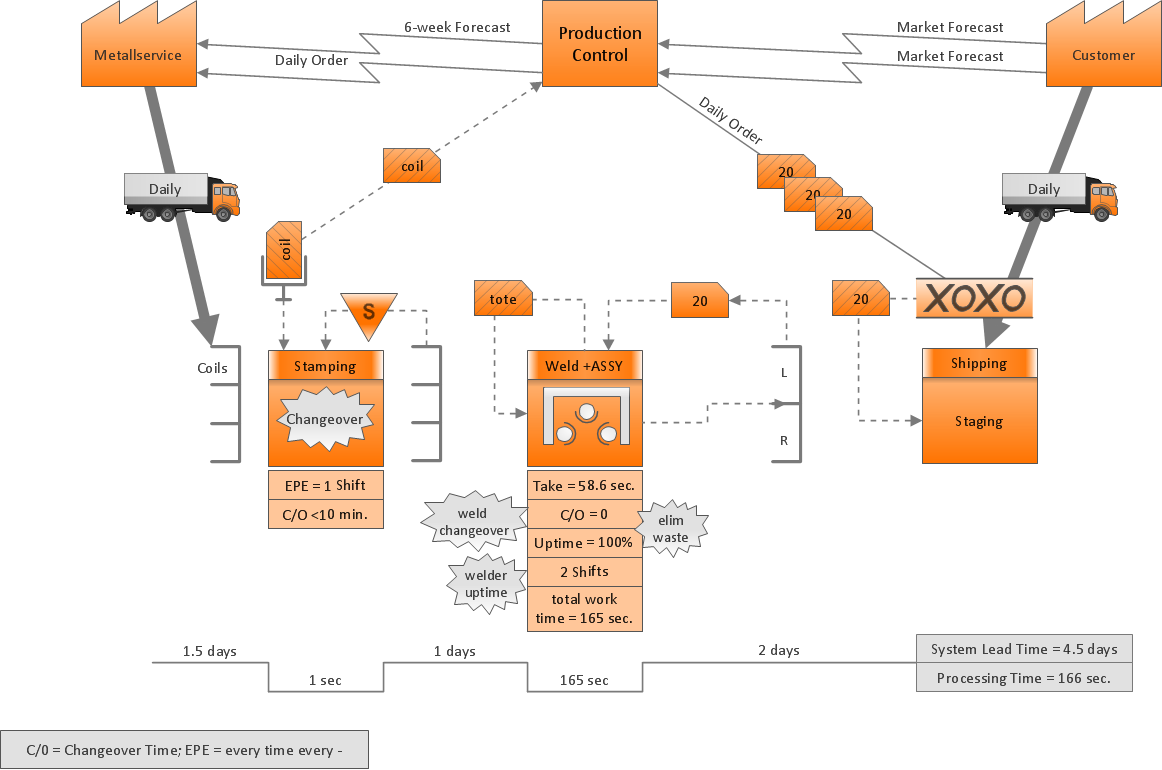
How to Create a VSM Diagram Using Solutions

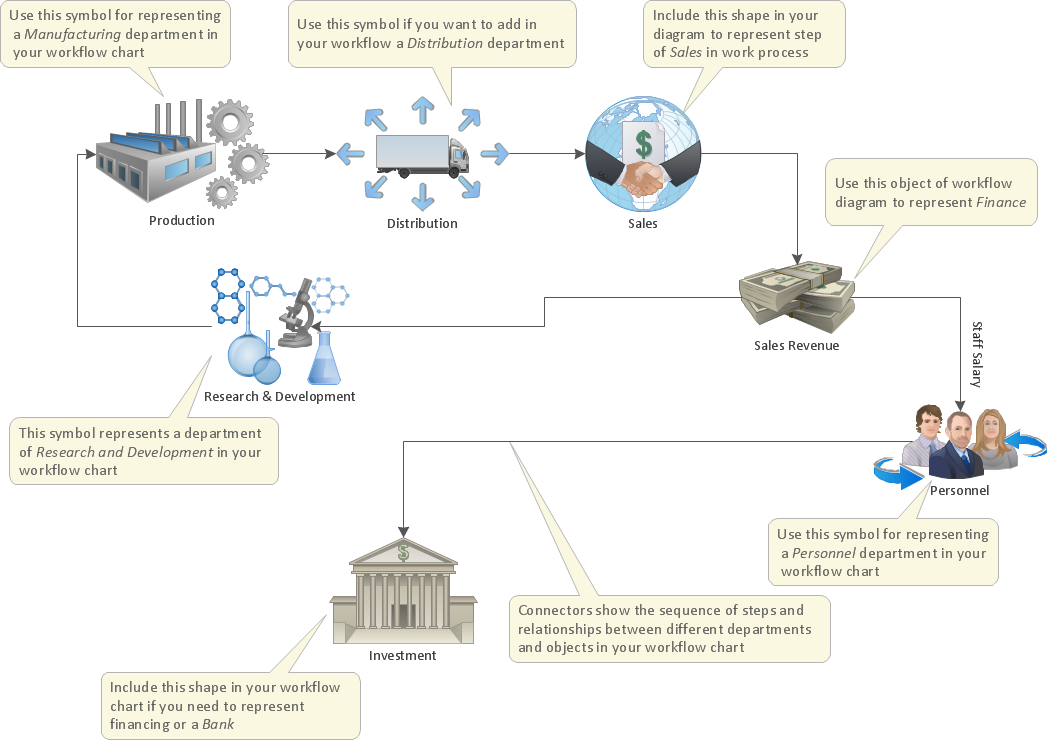
Optimize a Workflow
Software development with ConceptDraw DIAGRAM

Value Stream Mapping for the Lean Office
- A Diagram Of A Cross Cut Saw
- Tools - Vector stencils library | Cross Cut Hand Saw Diagram
- Tools - Vector stencils library | Draw And Label A Hand Trowel
- Tools - Vector stencils library | Hand Trowel Drawing And Labeled It
- Draw A Rake And Label It
- Label A Hand Saw
- Diagram And Labelling Of A Hand Spade
- Process Flowchart | Full Diagram And Label Of Spanner
- Diagrams And Label A Plier
- Diagram And Labelling Of A Screwdriver