 CRM Center Dashboard
The CRM Center Dashboard solution extends ConceptDraw DIAGRAM functionality with CRM software tools, large collection of CRM Charts live objects, CRM icons, CRM indicators, CRM maps and navigation elements, the set of professionally designed CRM samples and templates to help you construct your own CRM Dashboards and CRM Center Dashboards in a few minutes, to depict the current and actual data by connecting or refreshing the data source file. The customer management software ConceptDraw DIAGRAM makes you free to choose the style for your dashboard and to regulate the quantity of clipart on the diagram according to your taste.
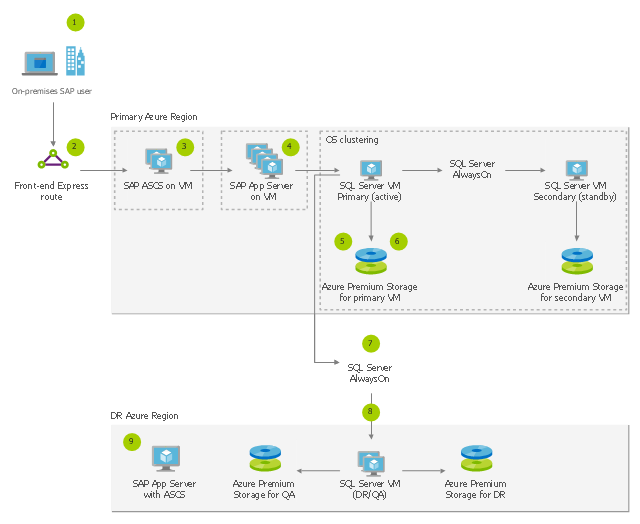
This Azure architecture diagram sample illustrates SAP NetWeaver on Microsoft SQL Server application solution.
It was designed on the base of the Azure architecture diagram from the Microsoft Azure website. [azure.microsoft.com/ en-in/ solutions/ architecture/ sap-netweaver-on-sql-server/ ]
"SAP NetWeaver is a technology of the software company SAP SE, and the technical foundation for many SAP applications. It is a solution stack of SAP's technology products. The SAP NetWeaver Application Server (sometimes referred to as WebAS) is the runtime environment for the SAP applications, and all of the mySAP Business Suite runs on SAP WebAS: supplier relationship management (SRM), customer relationship management (CRM), supply chain management (SCM), product lifecycle management (PLM), enterprise resource planning (ERP), transportation management system (TMS).
The product is marketed as a service-oriented architecture for enterprise application integration." [SAP NetWeaver. Wikipedia]
The Azure architecture diagram example "Solution architecture: SAP on Azure" was designed using ConceptDraw PRO software extended with Azure Architecture solution from Computer and Networks area of ConceptDraw Solution Park.
Marketing and Sales Organization chart. Organization chart Example

 Sales Flowcharts
The Sales Flowcharts solution lets you create and display sales process maps, sales process workflows, sales steps, the sales process, and anything else involving sales process management.
 Business Diagrams
The Business Diagrams Solution extends ConceptDraw DIAGRAM with an extensive collection of professionally designed illustrative samples and a wide variety of vector stencils libraries, which are the real help for all business-related people, business analysts, business managers, business advisers, marketing experts, PR managers, knowledge workers, scientists, and other stakeholders allowing them to design the bright, neat, expressive and attractive Bubble Diagrams, Circle-Spoke Diagrams, Circular Arrows Diagrams, and Venn Diagrams with different quantity of sets in just minutes; and then successfully use them in documents, reports, statistical summaries, and presentations of any style.
 Event-driven Process Chain Diagrams
Event-Driven Process Chain Diagrams solution extends ConceptDraw DIAGRAM functionality with event driven process chain templates, samples of EPC engineering and modeling the business processes, and a vector shape library for drawing the EPC diagrams and EPC flowcharts of any complexity. It is one of EPC IT solutions that assist the marketing experts, business specialists, engineers, educators and researchers in resources planning and improving the business processes using the EPC flowchart or EPC diagram. Use the EPC solutions tools to construct the chain of events and functions, to illustrate the structure of a business process control flow, to describe people and tasks for execution the business processes, to identify the inefficient businesses processes and measures required to make them efficient.
 Marketing Diagrams
Marketing Diagrams solution extends ConceptDraw DIAGRAM diagramming software with abundance of samples, templates and vector design elements intended for easy graphical visualization and drawing different types of Marketing diagrams and graphs, including Branding Strategies Diagram, Five Forces Model Diagram, Decision Tree Diagram, Puzzle Diagram, Step Diagram, Process Chart, Strategy Map, Funnel Diagram, Value Chain Diagram, Ladder of Customer Loyalty Diagram, Leaky Bucket Diagram, Promotional Mix Diagram, Service-Goods Continuum Diagram, Six Markets Model Diagram, Sources of Customer Satisfaction Diagram, etc. Analyze effectively the marketing activity of your company and apply the optimal marketing methods with ConceptDraw DIAGRAM software.
- Block Diagram Of Customer Relationship Management
- Servers | CRM Center Dashboard | HR Dashboard | Server Rack ...
- Block Diagram For Crm
- Invoice lifecycle | Software development with ConceptDraw PRO ...
- Workflow Crm
- Crm Data Flow Diagram
- Microsoft Dynamics Crm Flowchart
- Basic Flowchart Symbols and Meaning | Diagramming tool ...
- SharePoint server reference architecture for public-facing website ...
- Invoice lifecycle | Business diagrams & Org Charts with ...