Learn how to create a current state value stream map
Value Stream Mapping solution extends ConceptDraw PRO software with templates, samples and vector shapes for drawing the current state value stream maps.
 USA Maps
Use the USA Maps solution to create a map of USA, a US interstate map, printable US maps, US maps with cities and US maps with capitals. Create a complete USA states map.
 Australia Map
For graphic artists creating accurate maps of Australia. The Australia Map solution - allows designers to map Australia for their needs, offers a collection of scalable graphics representing the political geography of Australia, split into distinct state
 Spatial Infographics
Spatial infographics solution extends ConceptDraw PRO software with infographic samples, map templates and vector stencils libraries with design elements for drawing spatial information graphics.
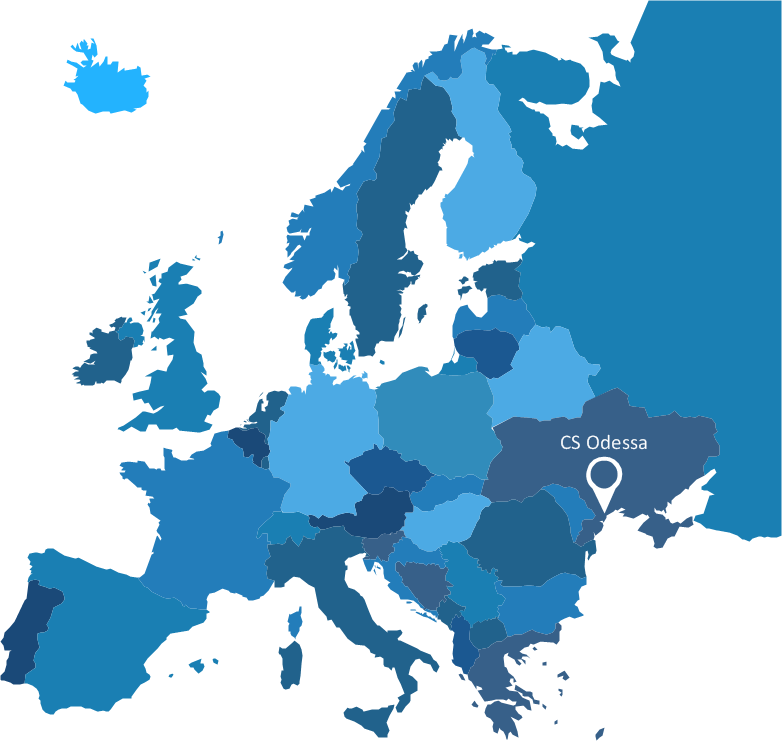
Spatial infographics Design Elements: Continental Map
ConceptDraw PRO is a software for making infographics illustrations. You can work with various components to build really impressive and easy-to-understand infographics design.Tools to Create Your Own Infographics
Over the past few centuries, data visualization has evolved so much that we use it every day in all areas of our lives. Many believe that infographic is an effective tool of storytelling, as well as analytics, and that it is able to overcome most of the language and educational barriers. Understanding the mechanisms of human perception will help you to understand how abstract forms and colors used in data visualization can transmit information more efficient than long paragraphs of text.Sample Pictorial Chart. Sample Infographics
Sample Pictorial Chart - Pictorial Infographics solution provides easy-to-use design infographics drawing tools, large collection of different sample infographics and infograms, sample pictorial chart and templates to be filled in, and 10 libraries with great quantity of predesigned vector pictograms. Use Pictorial Infographics solution to draw your own design pictorial infographics documents quick and easy.- Spatial infographics Design Elements: Continental Map | Map ...
- Infographic Design Agency
- Design elements - Marketing maps (G-20) | How to Create a ...
- How to Create Education Infographics | Design elements ...
- Computer and Internet Use in the United States | How to Draw a ...
- Geo Map - United States of America Map | Learn how to create a ...
- State The Basic Element Of Management
- Map Of The Us Showing States
- Learn how to create a current state value stream map | Map of USA ...
- May Of The United States


